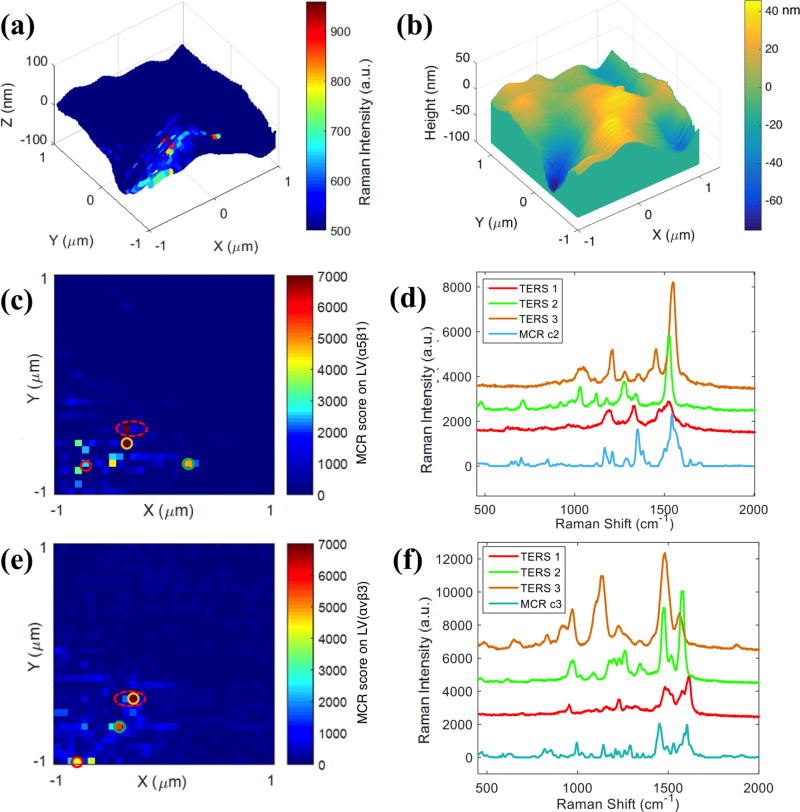
Figure 3.
TERS measurements on SW480 cell. (a) 3-D TERS map constructed with single-peak intensity at 1003 cm−1. (b) AFM topography map of the same area as (a). (c, e) MCR score maps created from (c) LV(α5β1) and (e) LV(αvβ3). (d, f) Extracted spectra from circled pixels in (c) and (e). Scan area: 2×2 μm. Step size: 62.5 nm per pixel.

