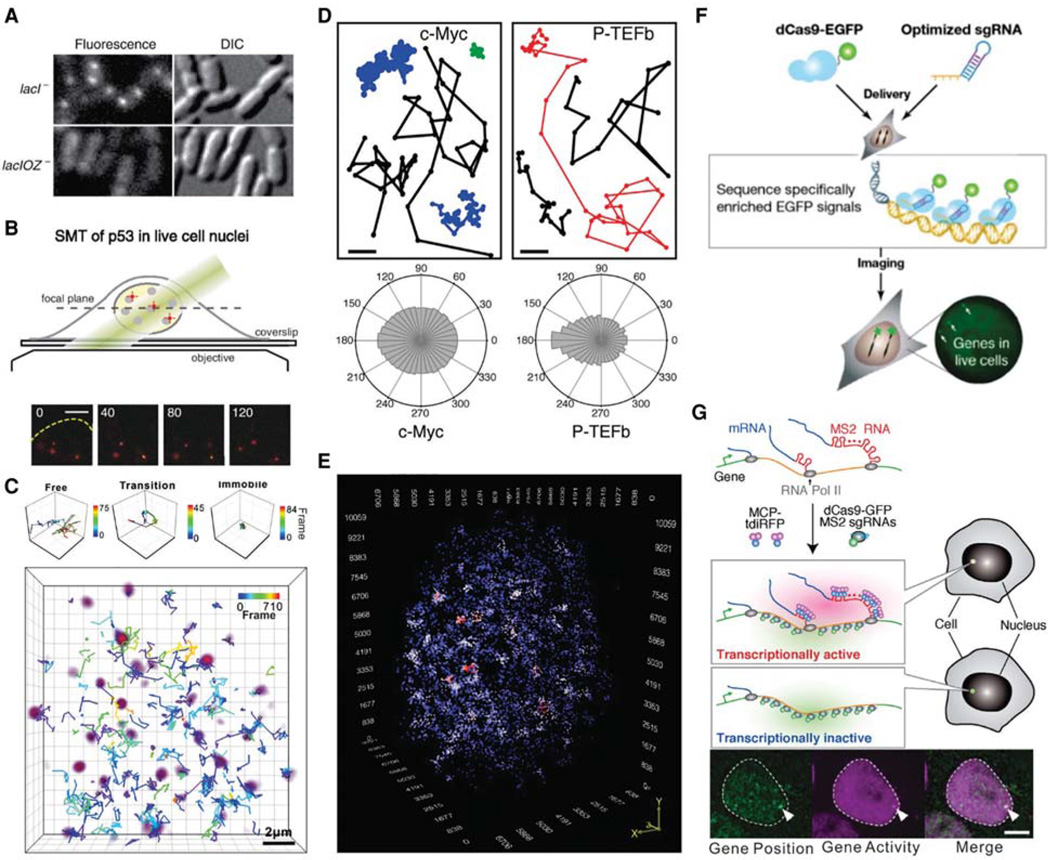
Figure 1.
Live-cell imaging of TF dynamics and genome organization. (A) Detection of binding of the LacI factor to its cognate DNA sequence (LacO) in bacteria at the single-molecule level. Fluorescence (left) and DIC (right) images (1 sec exposure) of LacI-Venus expressed from plasmid in the lacI2 and lacIOZ2 strains, respectively. Fluorescent spots represent individual molecules of LacI. (B) 2D imaging of p53 dynamics in cancer cells. (Top) Optical setup. (Bottom) Individual HaloTag-p53 molecules (red spots) labeled with tetramethylrhodamine (TMR) were imaged at different time points (in microseconds; yellow dashed line indicates the nuclear boundary). (C) Tracking of individual TF in 3D. A HaloTag-Sox2 construct was expressed in a single embryonic stem cell, labeled with TMR and imaged using multifocus microscopy (MFM). Volume rendering of a Sox2 single-molecule image (purple) superimposed with single-molecule trajectories. Three molecules with distinct behaviors were selectively displayed on the top (from left to right, freely diffusing particle, particle undergoing a free/bound transition, and immobile molecule). Color bar shows the corresponding frame number. Scale bar, 2 mm. (D) Distinct TFs explore the nucleus differently. Examples of single-molecule traces for c-Myc and P-TEFb (top). Distribution histograms, in polar coordinates, of the angle u formed between the vectors of two consecutive translocation steps for c-Myc and P-TEFb. c-Myc angle distribution is isotropic, characteristic of a global explorer, whereas P-TEFb is a local explorer that reaches a genomic target in a position-dependent manner. (E) 3D organization of Sox2-binding sites in live mES cells. mES cells expressing HaloTag-Sox2 were labeled by the membrane-permeable JF549 dye and imaged on a lattice light-sheet microscope (300-nm z-steps; 50 msec per frame). Single molecules were localized and tracked in 3D. Sox2 molecules dwelling at the same position for .3 sec were counted as stably bound. Spots represent stably bound events; color codes the local density of stable localizations (blue, low density; red, high density). (F) Cas9-based live-cell gene locus labeling. Naturally repetitive and unique endogenous gene loci can be labeled based on sequence complementarity using fluorescent, nuclease-deficient Cas9 complexes (dCas-EGFP). (G) Simultaneous imaging of gene position and activity (ROLEX) in mES cells. A cassette of 24 tandem MS2 sequence was knocked into the Nanog gene and used as a target for both Cas9-based labeling of the DNA locus position (with dCas-GFP, green) and MS2 labeling to report on transcription activity (see text; MCP-tdiRFP, purple). (A, Reprinted from Elf et al. 2007, with permission from AAAS; B, reprinted from Mazza et al. 2012; C, adapted from Chen et al. 2014b; D, adapted from Izeddin et al. 2014; E, reprinted from Liu et al. 2014; F, reprinted from Chen et al. 2013, with permission from Elsevier; G, adapted from Ochiai et al. 2015.)

