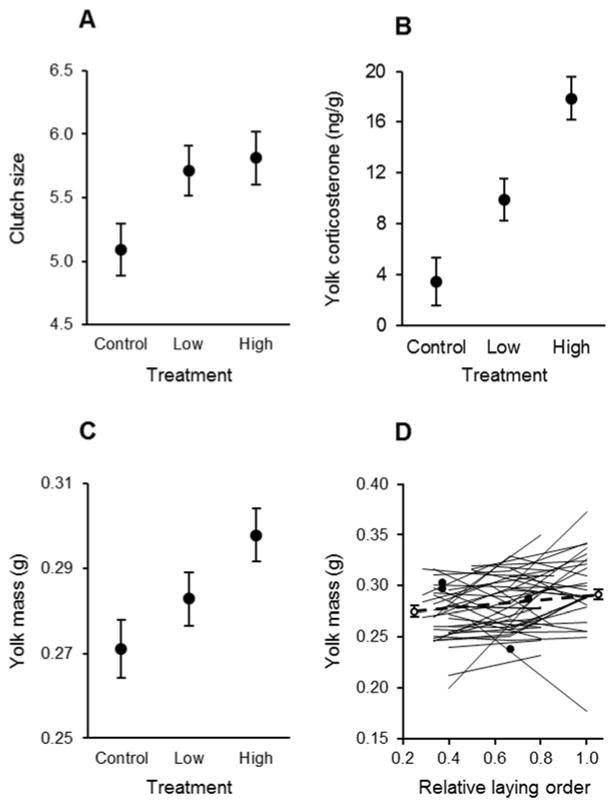
Fig. 2.
(A–C) Clutch size, yolk-corticosterone concentration, and yolk mass in relation to treatment (least-squares means ± SE). (D) Yolk mass in relation to relative egg-laying order (egg number divided by clutch size); plotted are individual reaction norms for each female (filled dots represent a single egg from the clutch), and least-squares means ± SE are plotted on each side of the reaction norms for egg 2 and for last-laid and penultimate eggs.

