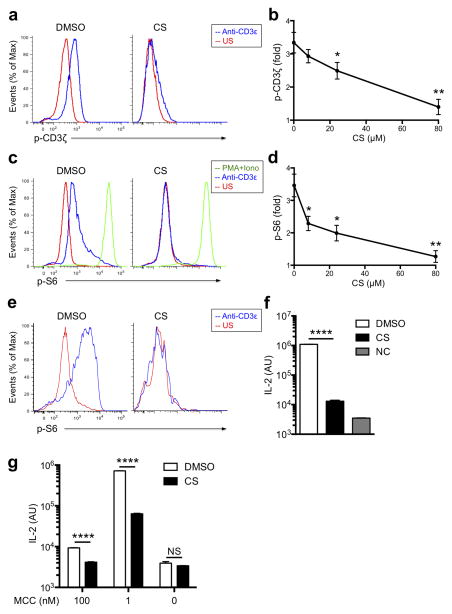
Figure 1. Cholesterol sulfate blocks TCR signaling.
(a) Phospho-flow cytometry analyzing phosphorylated (p-) CD3ζ in cells treated with the vehicle DMSO (left) or 100 μM CS (right), then left unstimulated (US) or stimulated with anti-CD3ε. (b) The CS titration curve for fold changes of p-CD3ζ upon stimulation by anti-CD3ε. (c) Phospho-flow cytometry analyzing phosphorylated (p-) S6 in cells treated with the vehicle DMSO (left) or 100 μM CS (right), then left unstimulated (US) or stimulated with PMA and ionomycin (PMA + iono) or anti-CD3ε. (d) The CS titration curve for fold changes of p-S6 upon stimulation by anti-CD3ε. (e) Phospho-flow cytometry analyzing phosphorylated (p-) S6 in γδ T cells treated with the vehicle DMSO (left) or 100 μM CS (right), then left unstimulated (US) or stimulated with anti-CD3ε. (f, g) ELISA analysis of IL-2 from T cells treated with DMSO and CS, stimulated with pMCC-I-Ek loaded lipid bilayers (f) or MCC-pulsed CH27 APC cells as indicated concentrations (g). IL-2 abundance was presented in arbitrary units (AU) on a log scale. NC, non-stimulated control. *P < 0.05; **P < 0.01; ****P < 0.0001; NS, not significant, unpaired t-test mean and s.e.m. (b,d,f,g). Data are from one experiment representative of three independent experiments with similar results (a,c,e) or three independent experiments with biological duplicates in each (b,d; n = 2, f,g; n = 3).

