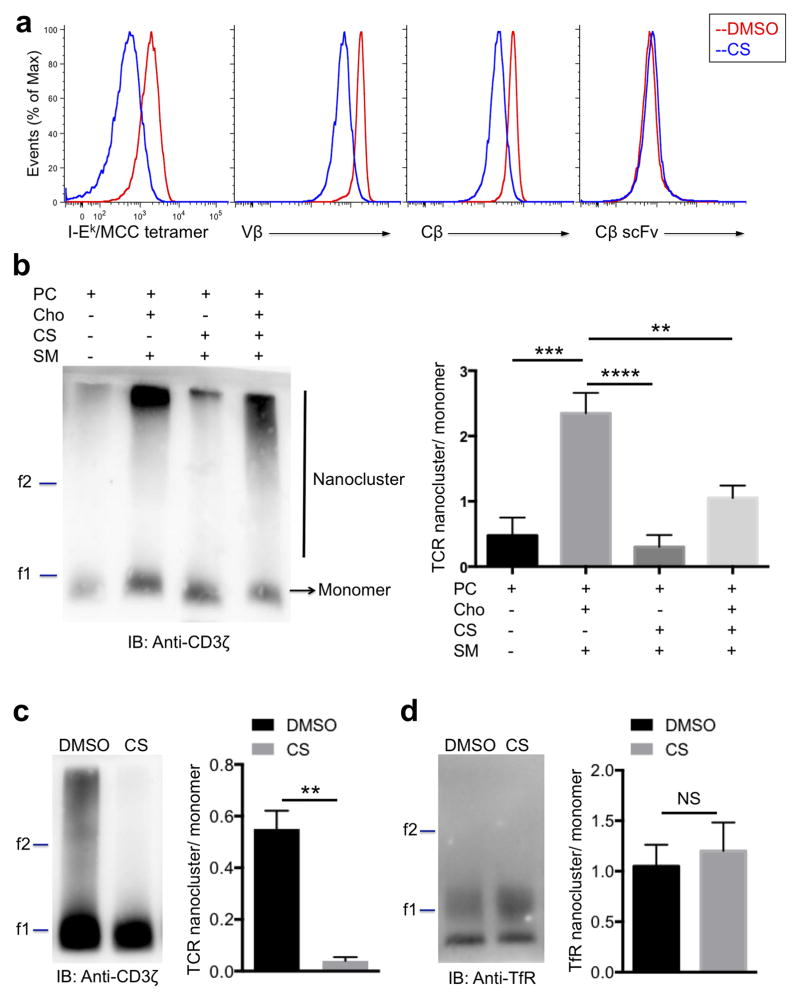
Figure 2. Cholesterol sulfate disrupts TCR nanoclusters.
(a) Flow cytometry analyzing 5C.C7 T cells treated with DMSO (red) or CS (blue), stained with pMCC-I-Ek tetramer, anti-Vβ3 antibody (KJ25), anti-Cβ antibody (H57-597) or anti-Cβ single chain Fv fragment (scFv) as indicated. (b) Blue-Native PAGE and immunoblot analysis of TCR nanoclusters from proteoliposomes with indicated lipid compositions. The ferritin markers, f1 and f2 corresponding to 440 kDa and 880 kDa, are shown. Band intensities of nanoclustered and monomeric TCRs were quantified with the Li-Cor Odyssey infrared imager and shown as a ratio of the two forms. (c, d) Blue-Native PAGE and immunoblot analysis of TCR and TfR nanoclusters from cells treated with DMSO or CS. Band intensities of nanoclustered and monomeric TCR or TfR were quantified with the Li-Cor Odyssey infrared imager and shown as a ratio of the two forms. **P < 0.01; ***P < 0.001; ****P < 0.0001; NS, not significant, unpaired t-test mean and s.e.m. (b,c,d). Data are from one experiment representative of three independent experiments with similar results (a,b,c,d) or three independent experiments with biological duplicates in each (b; n = 3, c,d; n = 2).

