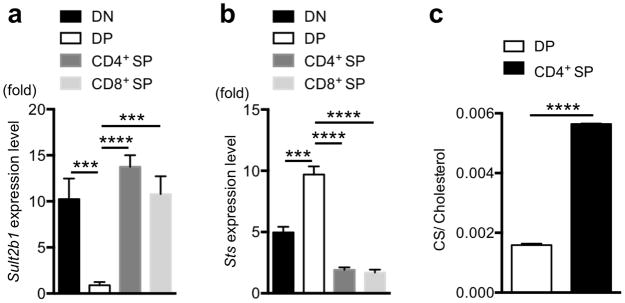
Figure 4. Developmental regulation of CS abundances in thymocytes.
(a, b) Quantitative PCR analysis of SULT2B1 and STS mRNA from sorted DN, DP, CD4+ SP and CD8+ SP thymocytes. β-actin was used for normalization. (c) Mass spectrometry quantification of CS and cholesterol from DP and CD4+ SP thymocytes. Total lipids were extracted from sorted thymocyte populations, and CS and cholesterol were quantified by small molecule mass spectrometry. The ratio of CS/cholesterol is shown. ***P < 0.001; ****P < 0.0001, unpaired t-test mean and s.e.m. (a,b,c). Pooled data are from three individual experiments (n = 4).

