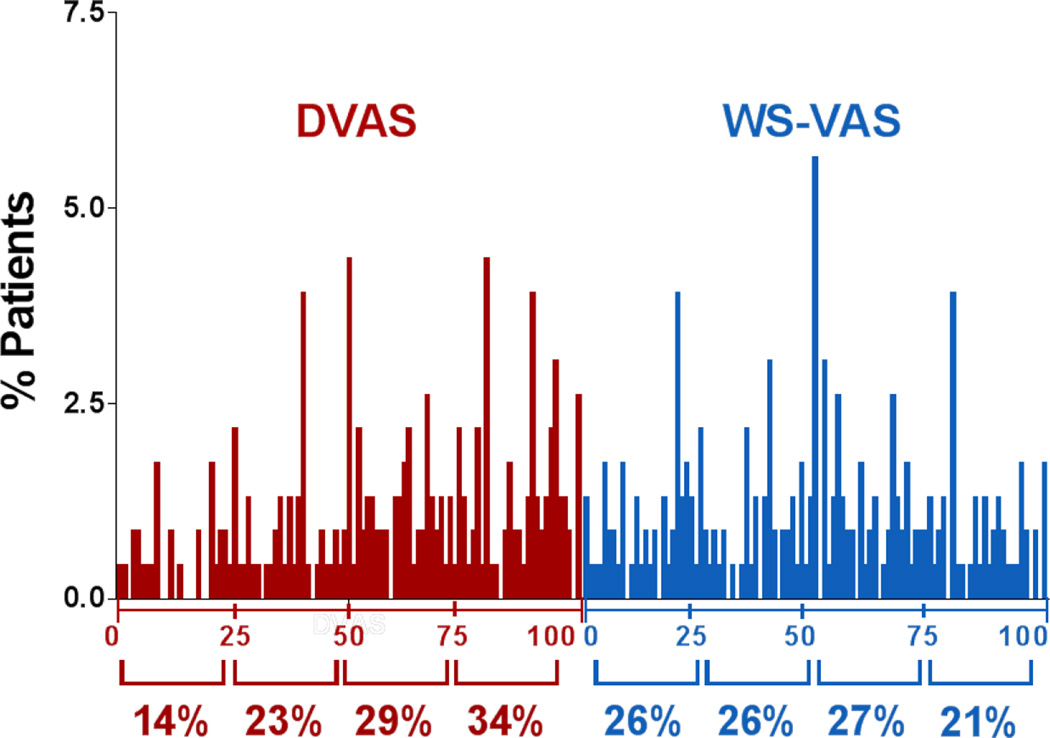
Figure 1. Distribution of symptom scores at enrollment.
The frequency distribution of the dyspnea visual analogue scale (DVAS: n= 230), or worst symptom visual analogue scale (WS-VAS; n=230) are shown per quartile of each scale. Patients were more evenly distributed across the range of possible WS-VAS scores compared to DVAS scores.

