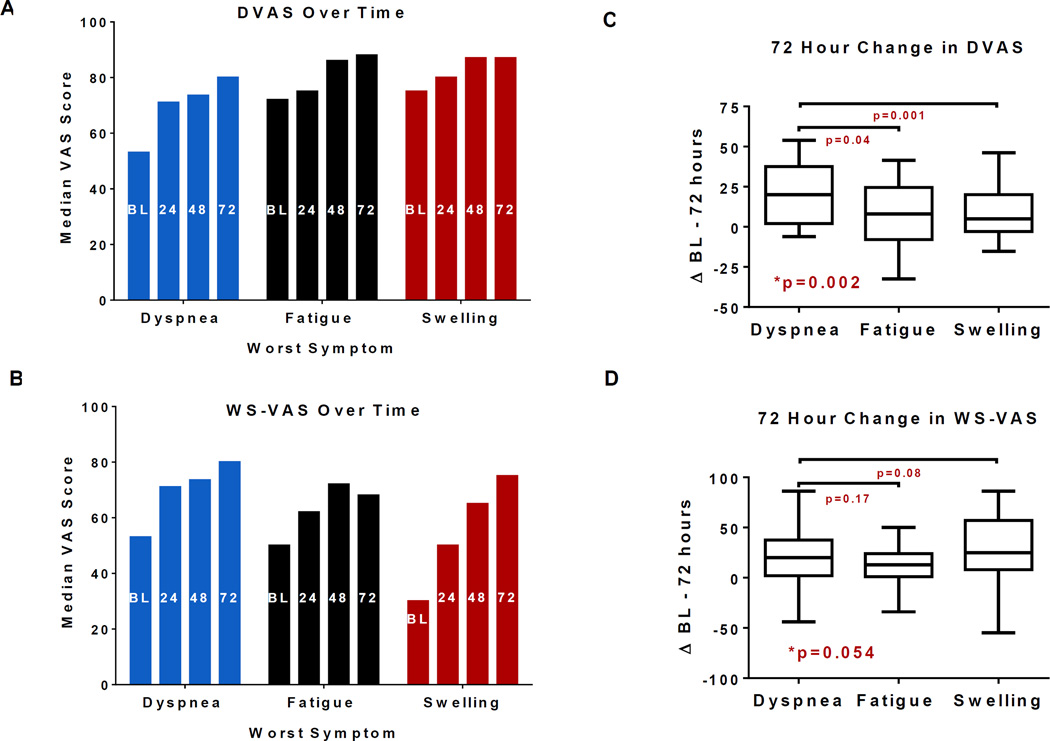
Figure 2. Symptom scores over time.
Median dyspnea visual analogue scale (DVAS: A), or worst symptom visual analogue scale (WS-VAS; B) at enrollment (BL) through 72 hours. Both scores increased over time within each WS group (p<0.0001 for all). Median (IQR) for changes in DVAS (C) or WS-VAS (D) from BL to 72 hours according to the self-identified worst symptom (dyspnea, fatigue or body swelling); *p: overall Kruskal-Wallis test. The p values for comparison between patients with fatigue or with body swelling versus those with dyspnea (Mann Whitney test) are shown.

