Figure 2.
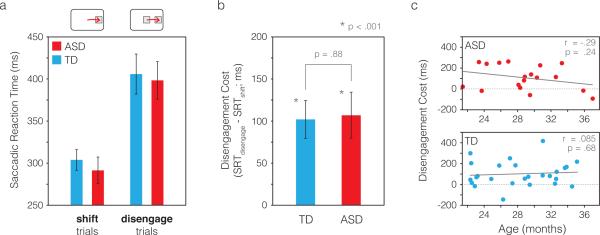
Saccadic reaction times and disengagement costs. a) Mean saccadic reaction times are shown for each group, separated by trial type (shift trials vs. disengage trials). If toddlers with ASD have “sticky” attention, they should show a larger difference between SRTs in shift trials and disengage trials than TD toddlers, reflecting more time required to disengage attention. Panel b shows this difference, the disengagement cost, in each group. While each group showed a highly significant disengagement cost individually (p < .001), there was no difference in disengagement costs between groups (p = .88). c) Disengagement cost was not significantly correlated with age in either group. Solid gray lines show least-squares linear fits to the data in each group. Error bars were computed with a bootstrapping procedure (Efron, 1981) in which subjects were subsampled with replacement on each of 10,000 iterations, and the group mean computed on each iteration. The error bars shown are the SD of the resulting bootstrapped distribution, reflecting the standard error of the group mean.

