Fig 7.

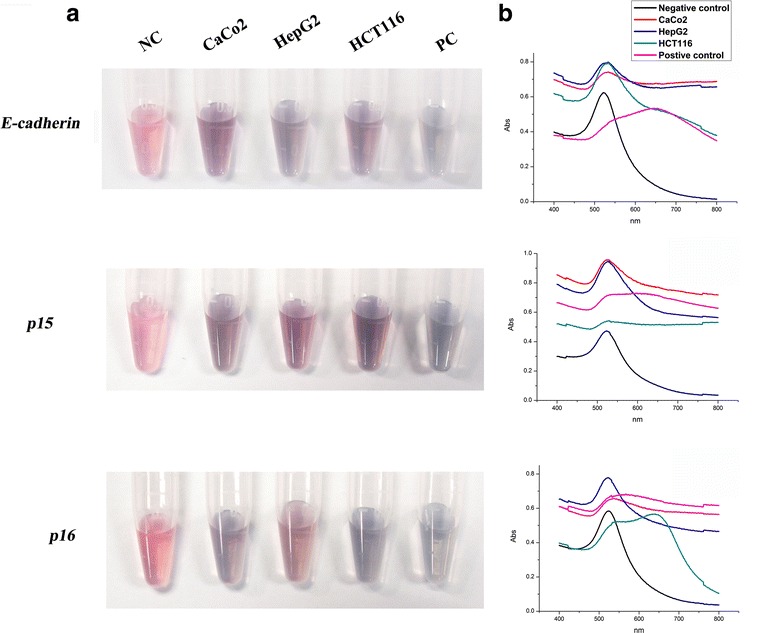
Visual detection of DNA methylation of E-cadherin, p15, and p16 in CaCo2, HepG2, and HCT116 cell lines. Visual detection of different samples in 5.0 mol/L NaCl solution (a). Changes in UV-spectra (b)

Visual detection of DNA methylation of E-cadherin, p15, and p16 in CaCo2, HepG2, and HCT116 cell lines. Visual detection of different samples in 5.0 mol/L NaCl solution (a). Changes in UV-spectra (b)