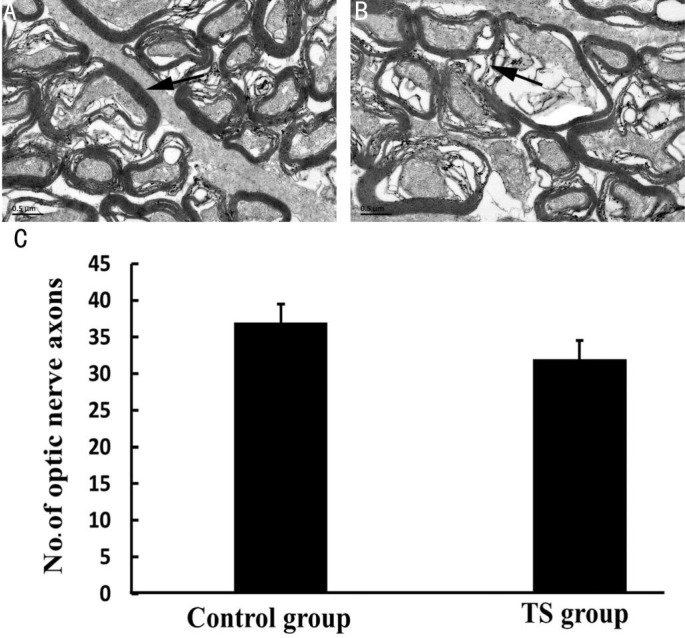
Figure 1. The ultrastructure of optic nerve axons by TEM and comparison of optic nerve axon density in rats between control group and TS group.
A: Optic nerve axons were closely aligned, and had compact myelin in normal rats (arrow); B: Optic nerve axons were swelling and sparsely aligned, even occurred in the lamellar separation and disintegration of myelin (arrow); C: The number of optic nerveaxons in TS group was 32.23±3.92 in TS group, vs 37.43±4.13 in control group in the same magnification field of view (P=0.0145). Scale bar=0.5 µm.

