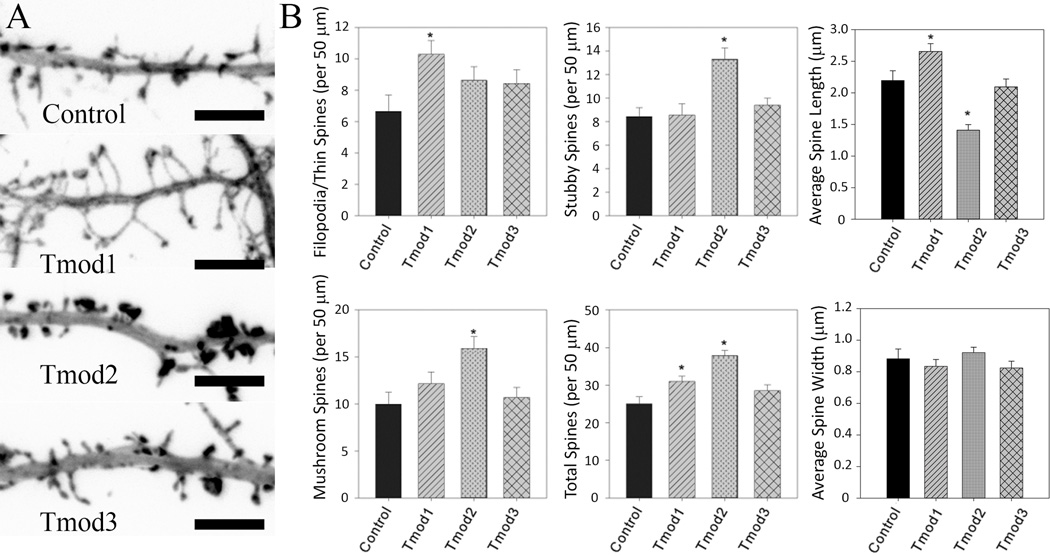
Figure 6. The impact of Tmod overexpression on dendritic spine number and shape.
Primary hippocampal neurons were transfected with ClFP-tagged wild type Tmods. A. Representative images of dendritic fragments of analyzed neurons. Shown images are RFP signals from RFP-actin used for spine analysis (scale bar = 6 µm). B. Bar graphs show quantification of number of filopodia/thin spines, mushroom spines, stubby spines, total number of spines, and spine width and length. Error bars indicate SEM. Asterisks indicate statistically significant difference from controls (ANOVA, P < 0.05).

