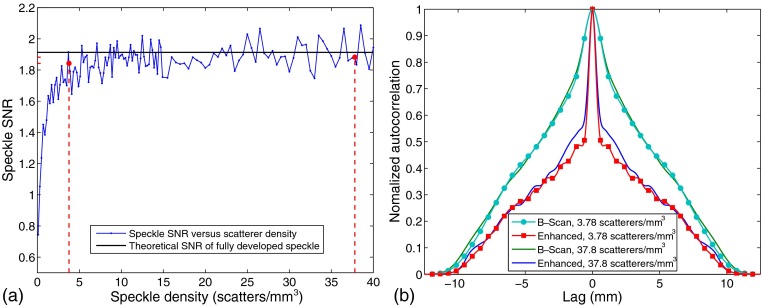
Fig. 12.
Comparison between (a) first- and (b) second-order statistics of independent images of pure speckle phantoms simulated in Field II as a function of scatterer density (). In (a), speckle envelope SNRs for the cases of 3.78 and are highlighted using red dash lines, compared to the theoretical value of 1.91 expected for fully developed speckle. In (b), the normalized autocorrelation functions for the envelopes of both the original B-scan and the processed, enhanced signals are shown.

