
FIGURE 6.
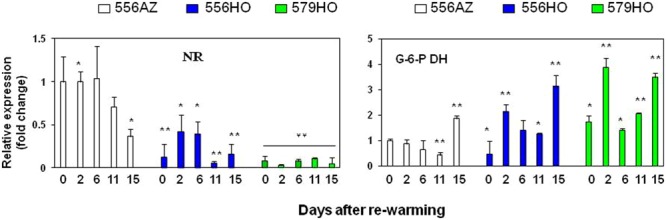
Quantitative PCR (Q-PCR) analysis of nitrate reductase (NR) and glucose-6-phosphate dehydrogenase (G-6-P DH) transcripts in tomato fruit pericarp samples. Methods including data quantification and statistical analysis were the same as described in the legend to Figure 5.