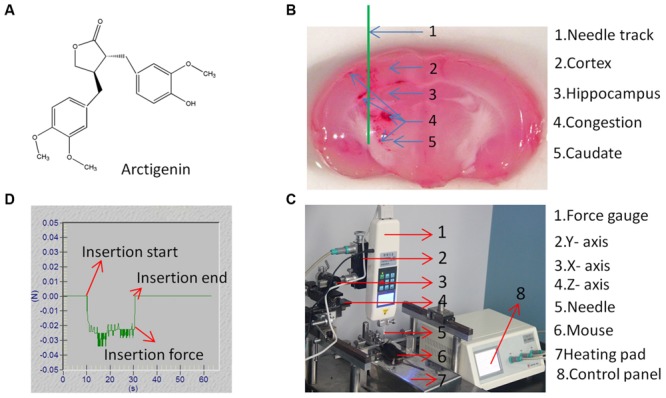
FIGURE 1.

Structure of arctigenin (ARC) and CED system. (A) The chemical structure of ARC. (B) Coronal section of the mouse brain showing a schematic of the needle track (in green). (C) Diagram of mouse model showing the CED system placement and site of stab in SWI brain injury. (D) Typical needle insertion force vs. time for brain tissue. The insertion speed was 0.2 mm/s, and the insertion force was measured by digital force gage.
