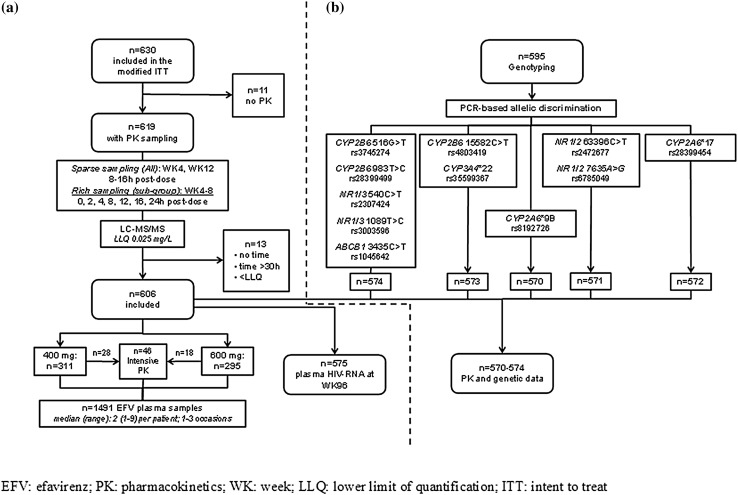
Fig. 1.
Flow diagram summarising a the data included in the population pharmacokinetic model and b genetic data available for analysis. EFV efavirenz, PK pharmacokinetics, LLQ lower limit of quantification, ITT intention to treat, LC–MS/MS liquid chromatography–tandem mass spectrometry, PCR polymerase chain reaction, WK week

