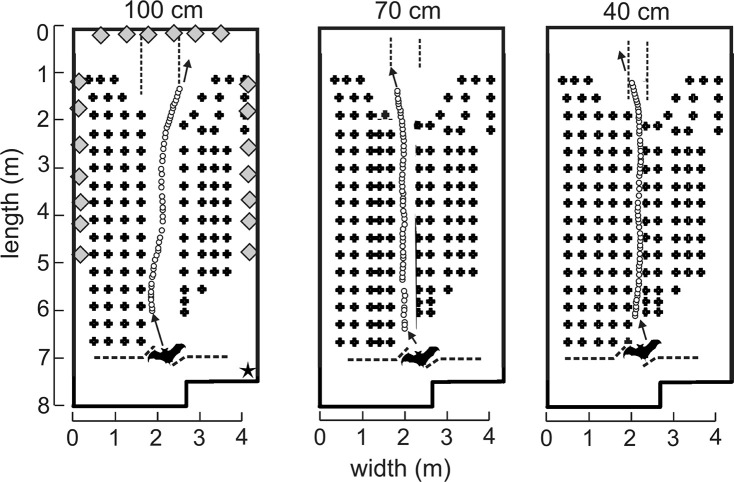
Figure 1.
Experimental flight room diagrams and example flights. Plan view of flight room (8.3 m long, 4.3 m wide, and 2.7 m high). Rows of vertically hanging plastic chains (plus signs, not to scale) were spaced 40 cm apart. Each bat was released through an opening in the net (dashed line at bottom) and flew down the corridor (spaced apart by 100, 70, or 40 cm) in the direction of the arrow to land on the back wall. Pulse emission locations (open circles) from an example bat (not to scale, bats wingspan = 30–32 cm) in one representative flight from each corridor were determined by time-difference of arrival (TDOA) measurements from 20 microphones distributed around the room (gray diamonds, not to scale). Microphones appearing next to one another in this diagram were spaced apart vertically. An infrared camera (star) was located in the top right corner of the front of the room such that bat flights could be monitored in real time.

