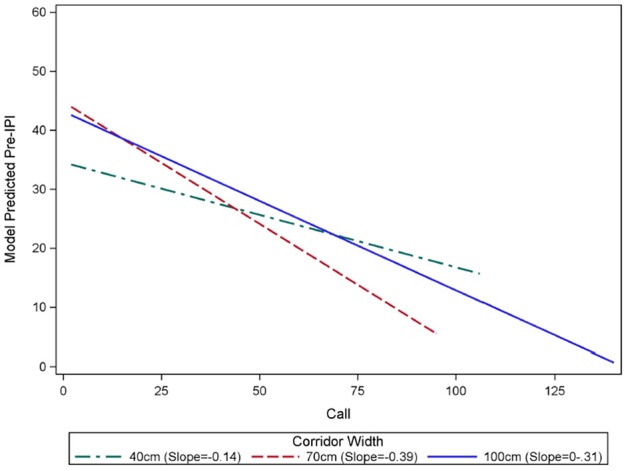
Figure 3.

Rates of decline in IPI over the course of flights in each corridor width. Generalized linear mixture modeling discovered an interaction between call number within a flight “Call” and IPI. The slope of pre-IPI over successive calls within a flight was significantly different in each corridor width (green = 40 cm, red = 70 cm, blue = 100 cm). Flights in the 100 cm wide corridor had an average starting IPI of 45.06 ms, and this IPI declined by 0.31 ms with each successive call in a flight. Flights in the 70 cm-wide corridor had an average starting IPI of 44.48 ms, and this IPI declined by 0.39 ms with each successive call in a flight. There was no significant difference between the starting IPIs in the 100 cm and 70 cm corridors (p = 0.5395). The average starting pre IPI for flights in the 40 cm corridor was 34.24 ms, and this IPI declined by 0.14 ms with each successive call in a flight. The starting IPI for flights in the 40 cm corridor was significantly shorter than the other corridor widths (p < 0.0001). The slopes of the model predicted IPI over the course of flights in each corridor width were significantly different from one another (p < 0.0001), with the 70 cm condition showing the fastest decline, and 40 cm having the slowest decline.
