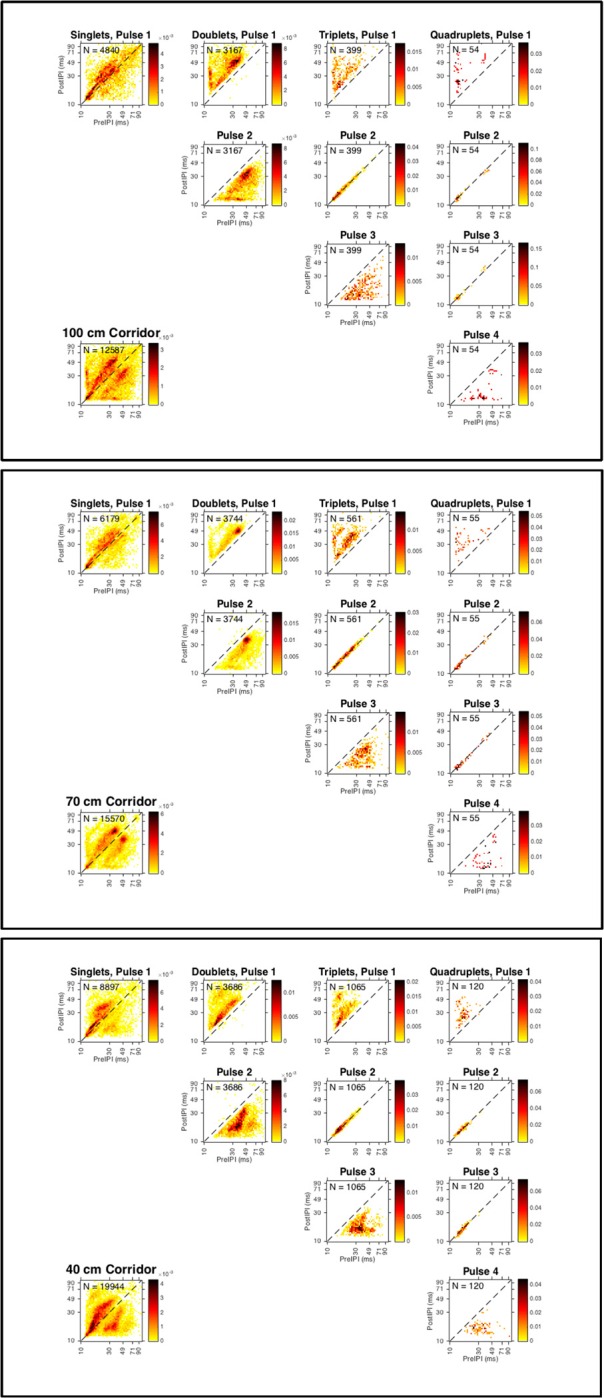
Figure 4.

Strobe groups for all bats in each corridor width. Discrete probability distributions for calls emitted by all bats in the 100 cm (top panel), 70 cm (middle panel), and 40 cm (bottom panel) corridors. Heat maps show high-density (red) and low-density (yellow) pre-IPI (x-axis, all plots) vs. post-IPI (y-axis, all plots) probability. Lower left plot shows total dataset for each corridor width. Each plot is shown with logarithmic axes to emphasize the extreme ends of the distribution, and the diagonal dashed line indicates the locations where pre and post IPIs are equivalent. Number of sonar sound groups (N) having 1 (singles), 2 (doublets), 3 (triplets), and 4 (quadruplets) are reported in the upper left legend for all group types (columns). Probability distributions of each successive echolocation pulse (rows) within each group type (columns) are shown. Sound groups were assigned using the definition proposed by Kothari et al. (2014).
