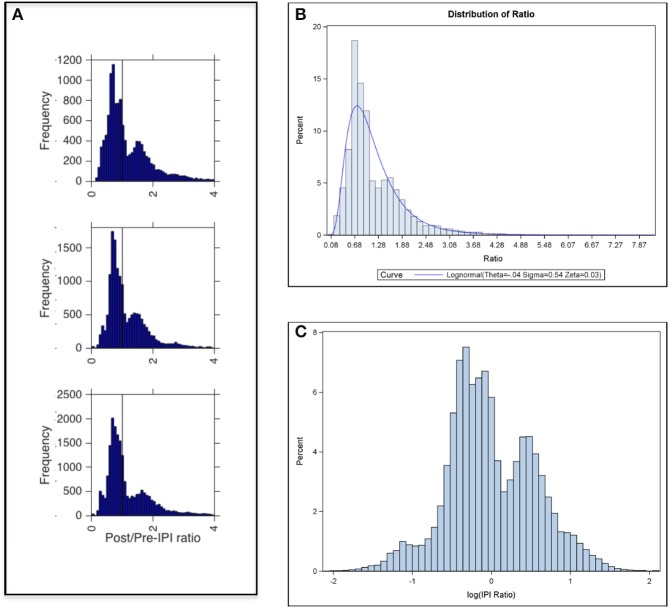
Figure 5.
Ratio of Post IPI to Pre IPI. (A) Frequency of post/pre-IPI ratios in the 100 cm (top panel), 70 cm (middle panel), and 40 cm (bottom panel) corridor widths. Peaks of bimodal distributions are ratios of ~0.7 and ~1.5. Vertical line marks a ratio of 1 (where pre IPI = post IPI). (B) Percent distribution of post-IPI to pre-IPI ratios across all corridor widths with a lognormal curve overlay. (C) Same plot as in (B) with x-axis showing log-transformed IPI ratios revealed a bimodal distribution.

