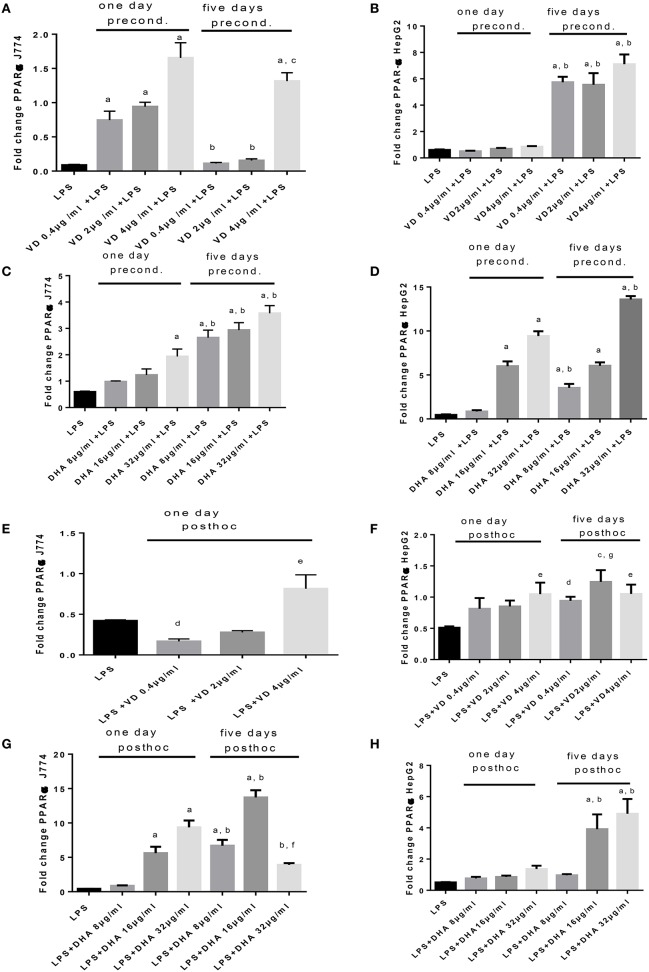
Figure 5.
(A–H) qPCR analysis of J774 (A,C,E,G) and HepG2 (B,D,F,H) for PPARα mRNA expression induced by LPS and modulated by preconditioning with Vitamin D (A,B) or DHA (C,D) or post-hoc (subsequent to LPS) stimulation with Vitamin D3(E,F) or DHA (G,H). Triplicate data were averaged, normalized to GAPDH mRNA abundance and expressed in relation to baseline PPARα mRNA expression. ap < 0.0001 compared to LPS, bp < 0.0001 compared to day 1, cp < 0.05 compared to day 1, dp < 0.05 compared to LPS, ep < 0.005 compared to LPS, fp < 0.001 compared to LPS, gp < 0.0005 compared to LPS (adjusted p-values).

