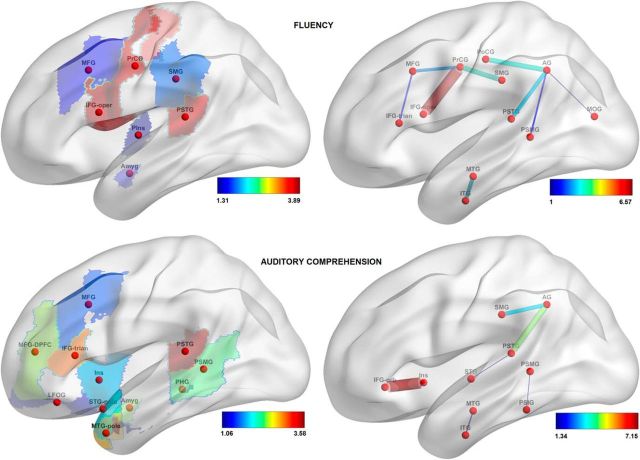
Figure 7.
Loadings on the features, reflecting their importance in predicting speech fluency scores (top row) and auditory comprehension scores (bottom row). In the left column, features are gray-matter cortical regions; in the right column, features are white-matter tracts. For abbreviations, see Table 6.

