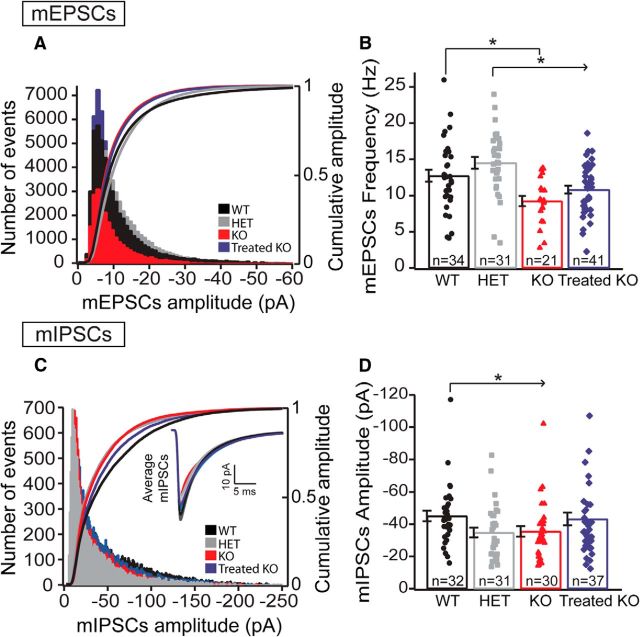
Figure 3.
Circuit connectivity is affected in KO neurons. Gene therapy is able to recover some parameters. mEPSCs: Decreased mEPSC frequency in L5 KO pyramidal neurons and recovery in the Treated KO. A, Histogram and cumulative distributions of mEPSC amplitudes from the four genotypes of the L5 pyramidal neurons (WT, n = 34 neurons; HET, n = 31 neurons; KO, n = 21 neurons; Treated KO, n = 41 neurons; one-way ANOVA Kruskal–Wallis test, p = 0.131). B, Bar graph with scatter plots representing the mean frequency in the four genotypes. The mEPSC frequency is reduced in KO neurons and is recovered in Treated KO neurons [WT, 12.75 ± 0.81 Hz, n = 34 neurons; HET, 14.51 ± 0.8 Hz, n = 31 neurons; KO, 9.25 ± 0.7 Hz, n = 21 neurons; Treated KO, 10.84 ± 0.53 Hz, n = 41 neurons; one-way ANOVA, p ≤ 0.001; Bonferroni's post hoc test (all pairwise), p < 0.05], whereas no difference was observed between WT-Treated KO and WT-HET. Error bars indicate ± SEM. mIPSCs: Decreased mIPSCs amplitude, but not frequency, in L5 KO pyramidal neurons compared with WT. Recovery using the gene therapy (Treated-KO). C, Histogram and cumulative distributions of mIPSC amplitudes from the four groups of the L5 pyramidal neurons. (Inset, mIPSC average in the four genotypes.) There is a significant reduction in amplitude in HET and KO when compared with WT (D). Bar graph with scatter plot representing the mean amplitudes in the four genotypes. Note that the amplitude is significantly decreased in HET and KO compared with WT. There is recovery in the amplitude when using the gene therapy (WT, −45.09 ± 3.32 pA, n = 32 neurons; HET, −34.79 ± 3.01 pA, n = 31 neurons; KO, −35.58 ± 3.28 pA, n = 30 neurons; Treated KO, −43.25 ± 3.90 pA, n = 37 neurons; one-way ANOVA Kruskal-Wallis test, p = 0.031; Dunn's post hoc test vs WT, p < 0.05). Error bars indicate ± SEM.

