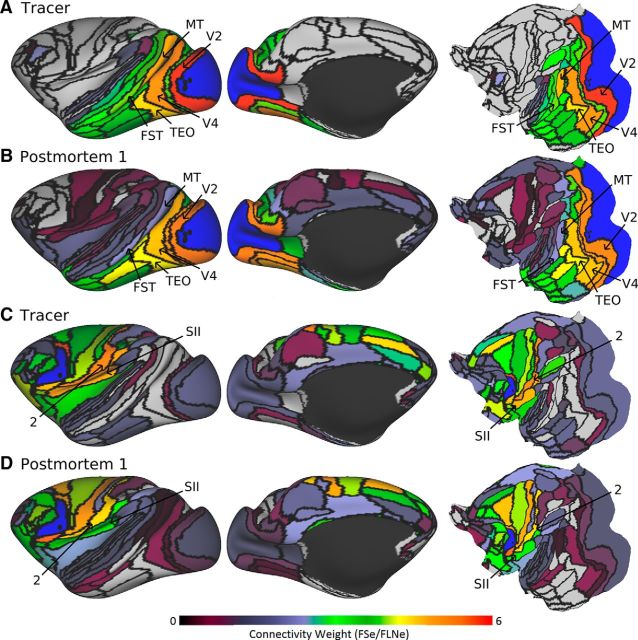
Figure 3.
Tracer and tractography log-scale connection weights for area V1 (A, B) and F5 (C, D). Retrograde tracer connection weights were based on FLNe to each injected area from the full 91-area parcellation. Tractography brain postmortem 1 was FSe. Areas V1 and F5 are labeled in blue in A, B and C, D, respectively. Black spheres illustrate the corresponding tracer injection sites for each area. Full data are available at https://balsa.wustl.edu/R698 and https://balsa.wustl.edu/R1Xr.

