Figure 4.
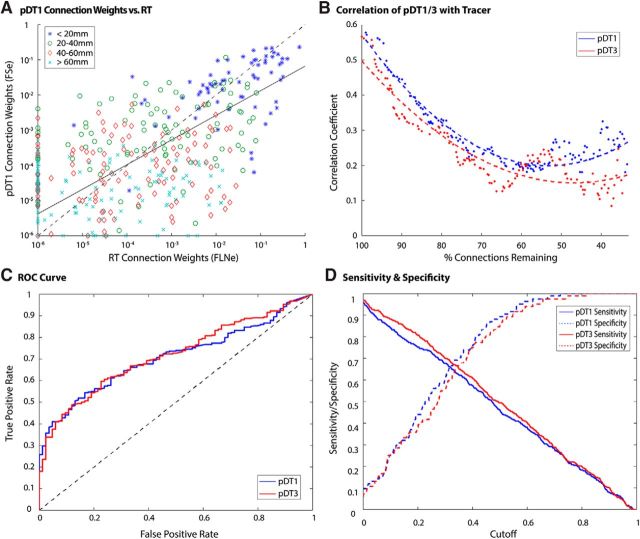
Tracer versus tractography performance comparison. A, Scatterplot of RT vs tractography (pDT1) log-scale connection weights in case PM1. Data points are depicted according to their corresponding path length bin (bin width = 20 mm; excluded path lengths > 80 mm, n = 10). The solid line denotes the least absolute residuals fit to data excluding points along either axis (false negatives: n = 13; false positives: n = 76). The dashed line (y = x) is for reference. B, Correlation between tractography and tracer connectivity weight in case PM1 for pDT1 and pDT3. Dotted lines represent second-order polynomial fits to the plotted data points. The horizontal axis depicts the number of connections remaining in tractography matrices. Only true positives were considered in this analysis. The final 10% of values were excluded due to low sample size. C, x-axis represents false positive rate (FPR); y-axis represents true positive rate (TPR). Results suggest similar performance for pDT1 and pDT3. D, Sensitivity and specificity were similar for pDT1/3. Cutoff refers to the experimental connection weight detection threshold.

