
Figure 5.
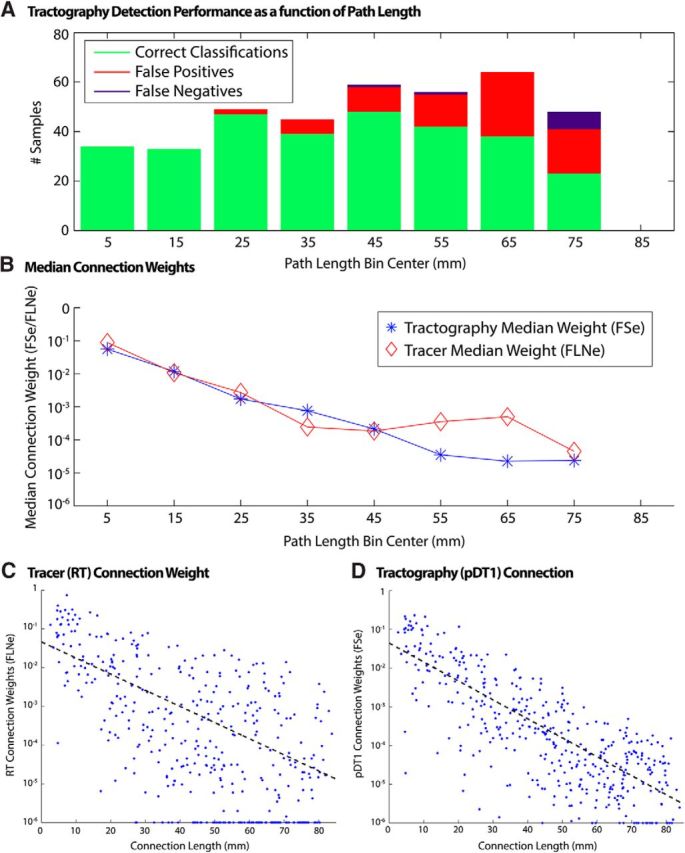
Tractography performance as a function of path length. A, Number of correct tractography detections, false positives, and false negatives (using tracer as ground truth). B, Median connection weights of correctly classified connections binned by tractography-measured connection path length. C, Tracer connection weights versus tractography-derived path length. D, Tractography connection weights versus tractography-derived path length. Solid lines correspond to least absolute residual fit to data excluding points along axes.