Figure 8.
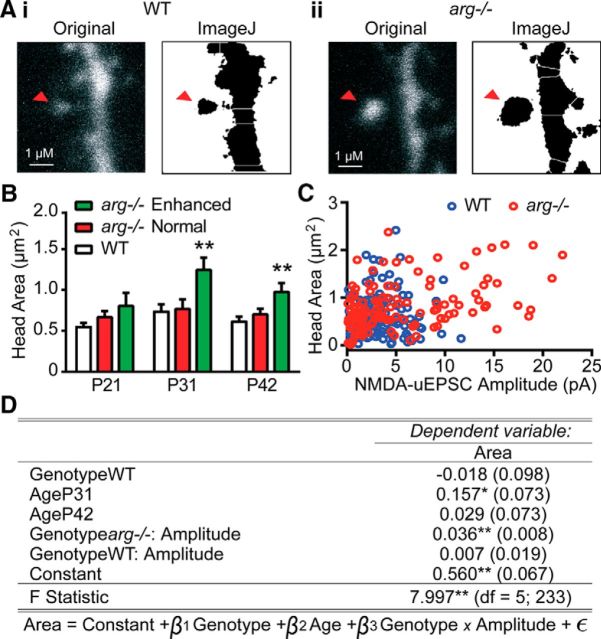
Spine head area correlates with NMDAR-uEPSC amplitude only in arg−/− CA1 neurons. A, Neurons were filled with Alexa Fluor-594 to visualize cell morphology. Spine head area (red arrowhead indicates measured spine) was measured in WT (Ai) and arg−/− (Aii) neurons. For each genotype, the left image is a raw two-photon capture, and the right image is a watershed transform used for head area quantitation. B, Average spine head area was unchanged at all ages between WT and the previously defined subpopulation of arg−/− spines that had normal NMDAR-uEPSCs (Fig. 7). In the previously defined subpopulation of arg−/− spines that had enhanced NMDAR-uEPSCs, the average spine head area was significantly increased at P31 and P42. **p < 0.01 vs WT. C, Scatter plot showing the relationship between spine head area and NMDAR-uEPSC amplitude in each spine from WT mice (blue circles) or arg−/− mice (red circles). D, Table of linear regression of NMDAR-uEPSC amplitude–genotype interaction on spine head area, with age and genotype as covariates. Estimates are given as regression coefficients (SEs). The baseline regression model is as follows: Genotypearg−/−, AgeP21. GenotypeWT, AgeP31, and AgeP42 are dummy variables representing the estimate for difference in mean from the baseline model. The coefficients for Genotypearg−/−:Amplitude and GenotypeWT:Amplitude are estimates of the slope of amplitude vs area for each genotype in units of pA/μm2. p Values are calculated from the appropriate t statistic for each regression coefficient. *p < 0.05; **p < 0.01.

