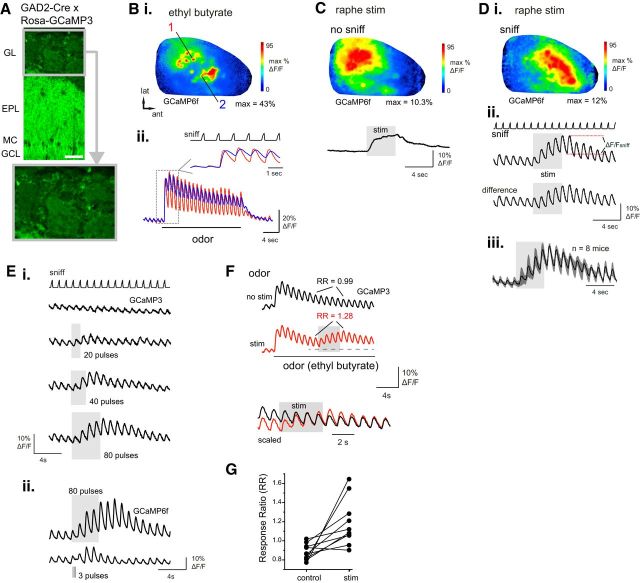
Figure 1.
Electrical stimulation of raphe enhances sensory responses in GAD65-positive OB neurons. A, Overview of GCaMP3 expression in the OB of a GAD2-Cre:Rosa-GCaMP3 cross. Bottom, Magnified view of glomerular layer, with individual PG somata visible around the periphery of the glomerulus. Scale bar, 50 μm. GL, Glomerular layer; EPL, external plexiform layer; MC, mitral cell layer; GCL, granule cell layer. B, Odorant-evoked GCaMP signals imaged from the dorsal OB of a GAD2-Cre:Rosa-GCaMP6f mouse. Bi, Response map showing change in fluorescence evoked by ethyl butyrate (0.1%, s.v.). Bii, Traces showing time course of GCaMP signal in two ROIs in the caudal-lateral (1) and rostral-medial (2) OB, with distinct inhalation-linked time courses in each ROI. Inset, Expansion of boxed region illustrating temporal differences. “Sniff” trace in inset shows timing of artificial inhalation. C, GAD2+ GCaMP6f signal evoked by raphe stimulation (20 Hz, 80 pulses) in the absence of inhalation-driven sensory input. Same preparation as in B. Top, Response map showing fluorescence change after raphe stimulus train. Note widespread increase with multiple foci of high-magnitude increases. Trace shows time course of GCaMP6f signal averaged across 10 ROIs from the same preparation. D, GAD2+ GCaMP6f signal during artificial inhalation of ambient air and raphe stimulation. Same preparation as in B. Di, Response map showing inhalation-linked fluorescence change during raphe stimulation, defined as ΔF/Fsniff in Dii. Inhalation-evoked responses are widespread across the dorsal OB but include distinct foci of peak enhancement. Dii, Time course of GCaMP6f signal (same ROIs as in C) during inhalation of ambient air (sniff), before and after (difference) subtracting the trace of raphe stimulation without inhalation, showing persistent increases in inhalation response amplitudes. Diii, Time course of mean GCaMP signal elicited by raphe stimulation, normalized and averaged across eight mice. Shaded area indicates SD across mice. Across all mice, stimulation strongly enhances inhalation responses, which persist for at least 8 s after stimulation ceases. E, Increasing raphe stimulus train duration increases both the magnitude and duration of the enhanced response to air inhalation. Ei, GCaMP3 traces taken from a single ROI during stimulus trains from 20 pulses to 80 pulses (all at 20 Hz). Current intensity, 400 μA. Eii, GCaMP6f traces from a different preparation comparing responses during the standard 80 pulse train (top) with responses to a train of 3 pulses of 1 ms duration, delivered at 10 Hz. Current intensity, 250 μA. F, Raphe stimulation increases inhalation-linked response magnitudes during odorant inhalation. Traces show mean signal averaged across 10 odorant-responsive ROIs from the same preparation, without (black) and with (red) raphe stimulation delivered during a prolonged odorant presentation (ethyl butyrate, 0.2%, s.v.). RR is defined as the ratio of the inhalation responses before and after stimulation within the same trial. See Results for details. Bottom traces show an excerpt from each trial (indicated by horizontal dashed line) with the vertical scales normalized to the same inhalation response amplitude for the inhalation just before the raphe stimulus train. G, Effect of raphe stimulation on odorant-evoked RRs, measured from signals averaged across 8–10 responsive ROIs in each of 10 preparations, with and without raphe stimulation. Each pair of points represents one mouse.

