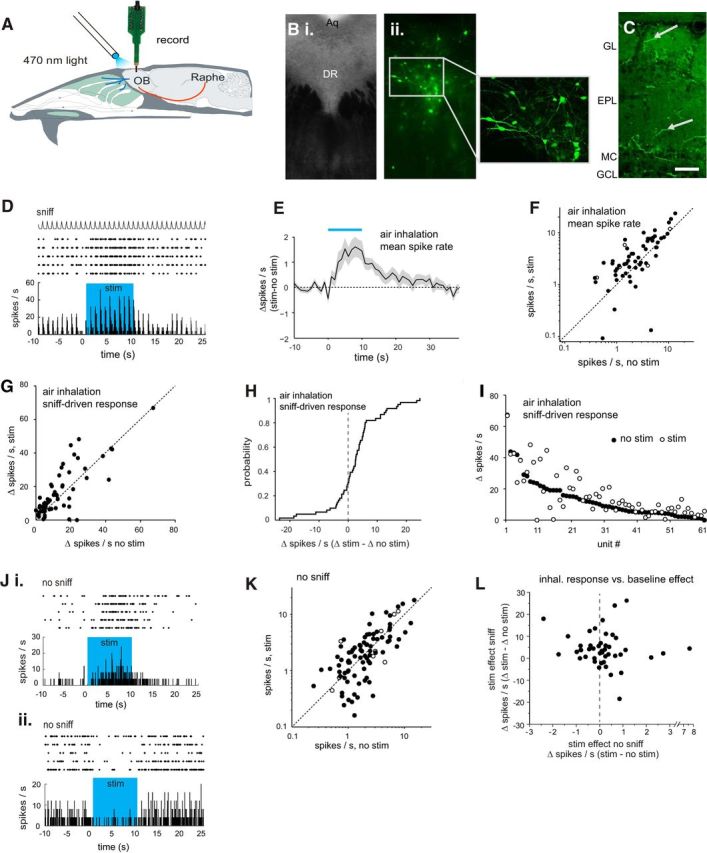
Figure 7.

Optogenetic activation of serotonergic OB afferents from raphe alters MT cell excitation. A, Schematic of experimental approach for electrical recording of presumptive MT cells during optical stimulation of serotonergic projections to the OB. See Materials and Methods for details. B, Images from midbrain tissue sections showing expression of CHR2-eYFP after injection of AAV-Flex-ChR2-eYFP into DRN of a Slc6a4-Cre mouse. Bi, Phase contrast bright-field image of region targeted for virus injection. Bii, Confocal image of the same section with higher-magnification of DRN region (inset, left) showing CHR2-eYFP expression in neurons throughout DRN. Aq, Cerebral aqueduct; DR, dorsal raphe. C, Confocal image taken from the OB showing eYFP expression in axonal fibers (arrows) in the glomerular and external plexiform layers, after injection of AAV-Flex-ChR2-eYFP into raphe. Scale bar, 50 μm. D, Spike raster and rate histogram showing spiking in a presumptive MT cell during inhalation of ambient air and optical stimulation (blue shaded area) in five repeated trials. Spike rate was calculated per 50 ms bin. Top trace (sniff) shows the time course of artificial inhalation. E, Time course of change in firing rate (mean ± SEM; n = 61 units from 9 mice) during optical stimulation (blue bar). The trace indicates change in mean spike rate in 1 s bins relative to the mean rate before stimulation. The time axis is relative to time of stimulation onset. F, Plot of MT cell firing rate averaged for the nine inhalations just before (no stim) and after (stim) optical stimulation for all 61 units. Filled circles indicate units subjected to a unit-by-unit test for significant effects of optical stimulation (5 trials per condition per unit). Open circles indicate units tested with three trials. G, Plot of the amplitude of the inhalation-linked spike burst during inhalation of ambient air (measured as change in firing rate relative to pre-inhalation baseline; see Materials and Methods for details) in the presence and absence of optical stimulation. H, Cumulative probability plot of the effect of optical stimulation on inhalation-linked responses, taken from same data shown in G. Note distribution of increases and decreases in firing rate with a bias toward firing rate increases. I, Same data as in G, with units ordered on the x-axis by the magnitude of their inhalation-linked response without optical stimulation (no stim, filled circles). Effects of optical stimulation (open circles) vary and are not obviously related to the magnitude of the inhalation-linked spike burst. J, Spike rasters and rate histograms showing examples from two units (Ji and Jii) of effects of optically stimulating serotonergic OB afferents on spontaneous activity, measured in the absence of inhalation (no sniff). Note qualitatively different effects in these two units. K, Plot of spontaneous spike rates in the absence (no stim) and presence (stim) of optical stimulation (n = 95 units, 6 mice,) plotted as in F. L, Effects of optical stimulation on baseline MT cell spiking in the absence of inhalation (stim no sniff) versus effects on inhalation-linked spiking (stim sniff) in the same unit, plotted for the subset of the units in I and K in which stimulation effects could be measured under both conditions.
