Figure 2.

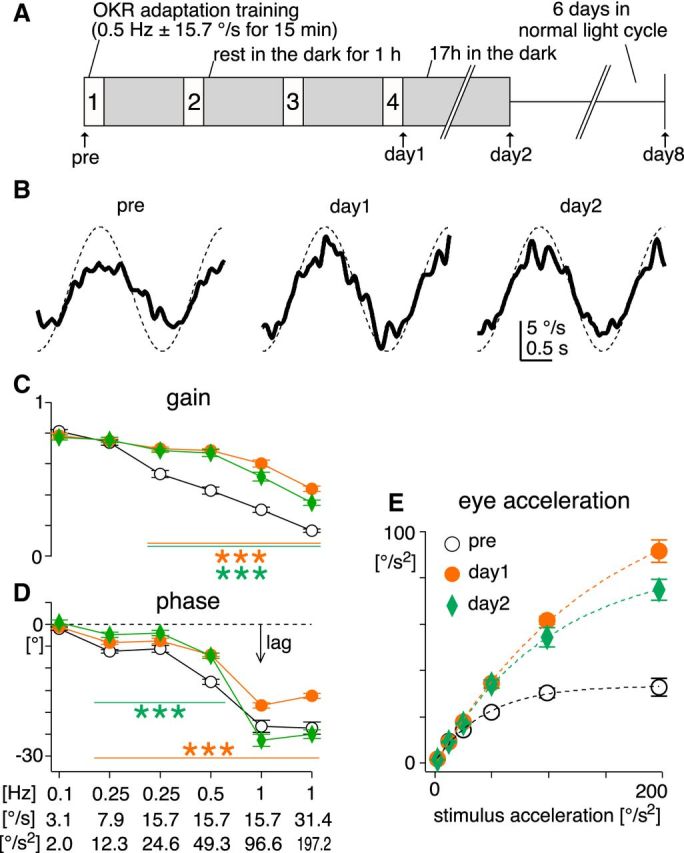
Changes in sinusoidal OKR after OKR adaptation training. A, OKR adaptation training paradigm, comprising four 15 min training sessions where sinusoidal visual stimulation (0.5 Hz ± 15.7°/s) was presented. After the pretraining recording (pre), mice were placed in a transparent cage at the center of an optokinetic drum, and subjected to the training stimulation with freely moving. Between the training sessions, mice rested for 1 h in their home cages in the dark (gray filled boxes). After the fourth training session, the OKR was examined (day 1). Then mice were returned to the home cages in the dark for ∼17 h until the recording in the following day (day 2). Subsequently, mice were returned to the normal light cycle, and recovery from the adaptation was tested 6 d after the day 2 recording (day 8). B, Average eye-velocity traces of the OKR evoked by sinusoidal stimulation of 0.5 Hz ± 15.7°/s (the same as the training stimulation) from a representative animal. Thick continuous and thin dotted traces are eye and stimulus velocity, respectively. C, D, Average gain [eye-velocity amplitude divided by stimulation-velocity amplitude (C)] and phase (D) of the OKR plotted against different stimulus conditions before (pre, black open circle), immediately after (day 1, filled orange circle), and ∼17 h after the OKR adaptation training (day 2, green diamond, n = 7 mice). Frequency, velocity amplitude, and acceleration amplitude of the stimulation are indicated below the x-axis. Negative value of phase means that eye movements lagged behind the stimulation. Statistical significance of the difference between pretraining values (open circle) and values at day 1 (orange filled circle) or day 2 (green diamond) are shown by lines and asterisks of corresponding colors. E, Average eye-acceleration amplitude plotted against stimulation-acceleration amplitude. Dotted lines are fitted exponential curves. Error bars, SEM.
