Figure 5.
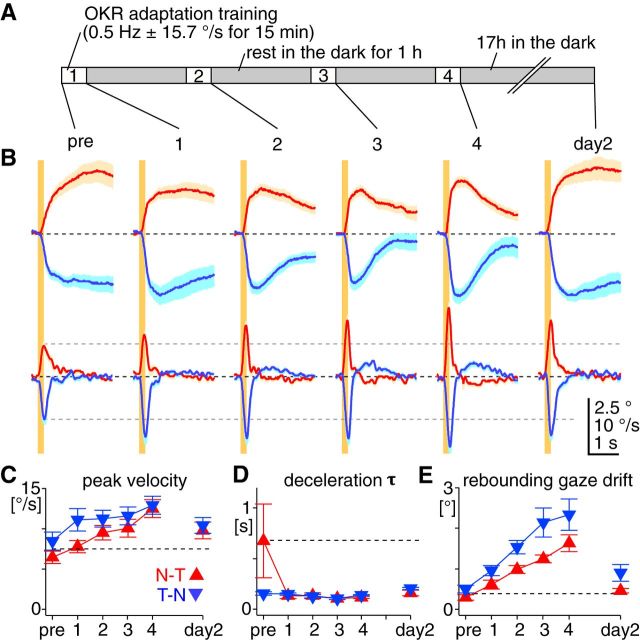
The changes in OKR kinematic features follow distinct time courses during OKR adaptation. A, Schematic illustration of the training and recording schedule. The OKR to 0.2 s constant-velocity stimulation at 30°/s was measured after every 15 min training session (1–4) as well as before the first training session (pre) and 17 h after the last training session (day 2). The training was by sinusoidal stimulation of 0.5 Hz ± 15.7°/s under the head-fixed condition. B, Average of average eye-position (top) and eye-velocity (bottom) traces of the OKRs evoked by 0.2 s constant-velocity stimulation (30°/s) at different times in the training (n = 7 mice). Traces were shown in the same way as in Figure 3A, B. C–E, Changes of peak eye velocity (C), deceleration τ (D), and rebounding gaze drift (E) over the course of the adaptation training. These kinematic features were measured from the OKRs evoked by 0.2 s constant-velocity stimulation at 30°/s. Graphs are organized in the same way as Figure 3C–F.

