Figure 7.

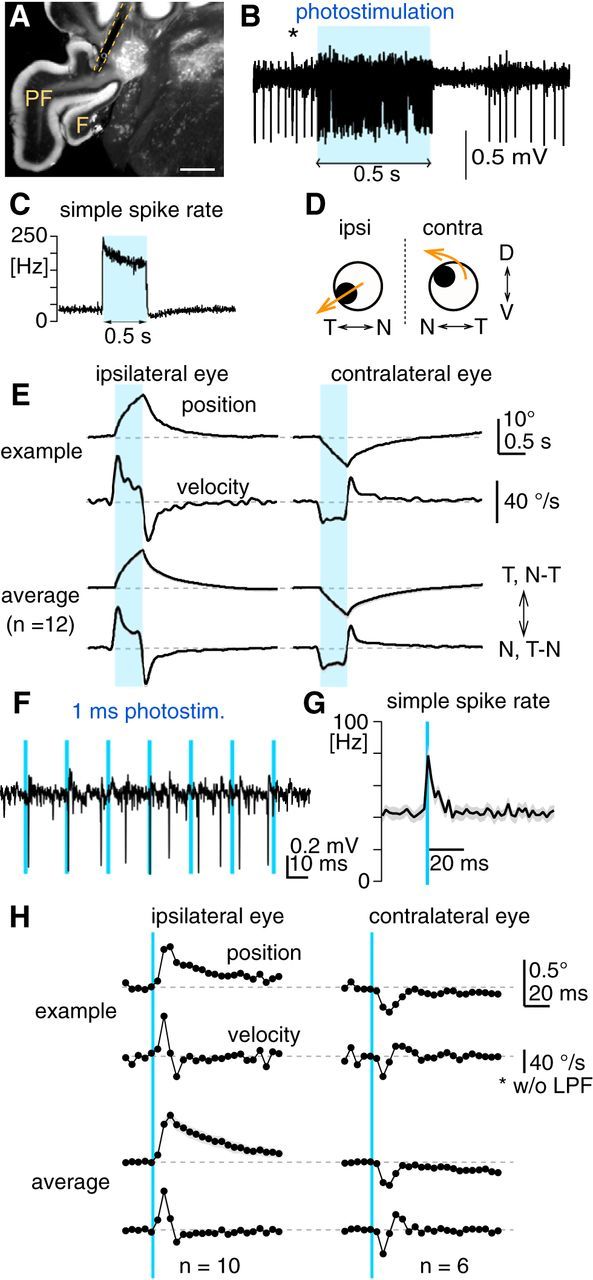
Eye movements evoked by PC-specific excitation using optogenetics. A, Representative fluorescent image of a coronal cerebellar section of an Pcp2-Cre;Ai27 mouse, showing the flocculus (F), paraflocculus (PF), and the track of the implanted optical fiber (dotted yellow line). The tip of the optical fiber was placed on the PC axonal bundles emerging from the parafloccular region of the floccular complex. Scale bar, 500 μm. B, An example of extracellular recording of a PC with axonal photostimulation via the implanted optical fiber. A continuous 0.5 s pulse of blue light (blue rectangle) excited PCs, which was followed by a pause of firing. A complex spike (*) verifies that the recording was from a PC. C, Average peristimulus histogram showing firing rate changes of PCs (n = 59) in response to 0.5 s light pulse. Bin, 2 ms. D, Schematic summary of eye movements evoked by unilateral photoexcitation of floccular complex PCs. N, Nasal; T, temporal; D, dorsal; V, ventral. E, Horizontal eye movements evoked by unilateral PC photoexcitation with 0.5 s light pulse (blue bars). Left and right columns show movements of the ipsilateral and contralateral eyes, respectively. The top two traces show average eye-position and eye-velocity traces from a representative animal. The bottom two traces are average of average eye-position and eye-velocity traces from 12 animals, where gray shading along traces are SEM. F, Extracellular recording of a PC during photostimulation by a train of 1 ms light pulses. Each 1 ms light pulse elicits at most one spike. G, Average peristimulus histogram showing firing-rate changes of PCs (n = 25) in response to 1 ms light pulse. Firing rate transiently increases for ∼15 ms after the light pulse, which was not followed by firing inhibition or pause. Bin, 2 ms. H, Horizontal eye movements evoked by unilateral PC photoexcitation with 1 ms light pulse (blue lines). The graphs are organized in the same way as in E. Average of average eye-position and eye-velocity traces for the ipsilateral and contralateral eyes were made from 10 and 6 mice, respectively. For better temporal resolution of the onset response, eye-velocity traces shown were not low-pass filtered. Note that eye-movement onset timing accuracy is potentially compromised by a transport delay of the video-oculography system (range: 2.05–3.75 ms).
