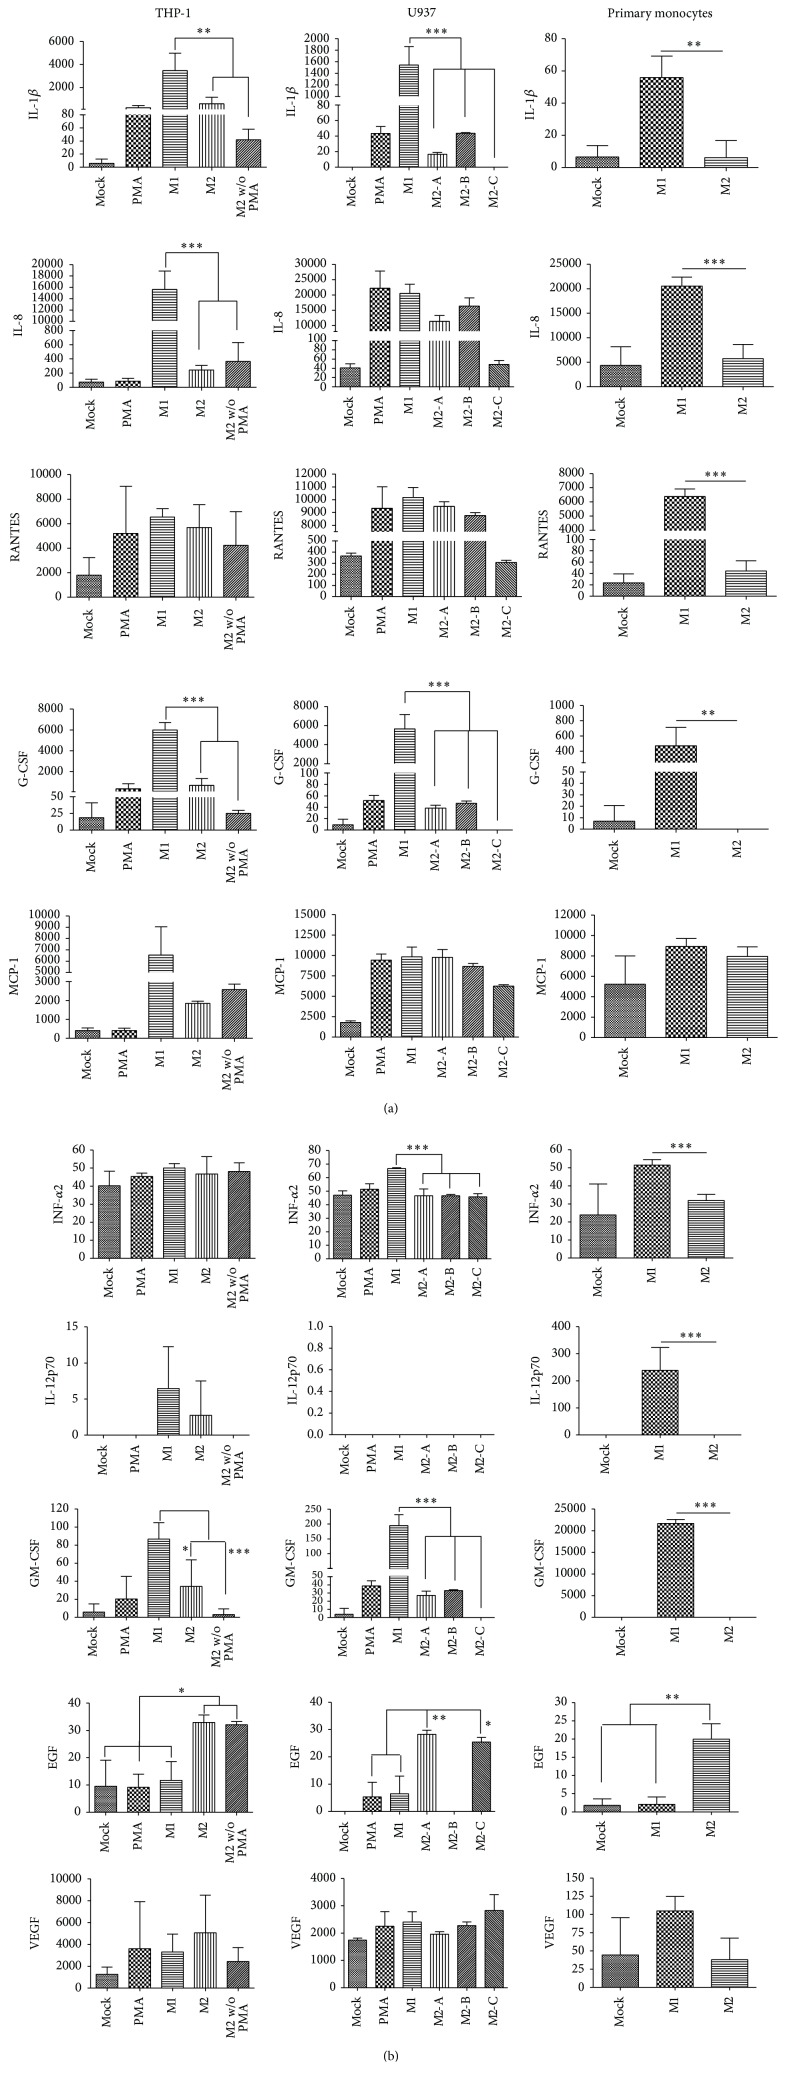
Figure 5.
Analysis of the profile of cytokine expression. Concentrations expressed in pg/mL of IL-1β, IL-8, RANTES, G-CSF, MCP-1, INF-α2, IL-12p70, GM-CSF, EGF, and VEGF measured in supernatants harvested from all different polarizing treatments and controls and analyzed in the Luminex MAGPIX® multiplexing instrument. For THP-1, mock: no stimulated cells; PMA: PMA-only control; M1: PMA + LPS + INF-γ; M2: PMA + IL-4 + IL-13; and M2 w/o PMA: IL-4 + IL-13. For U937, mock: no stimulated cells; PMA: PMA-only control; M1: PMA + LPS + INF-γ; M2-A: PMA + IL-4 + IL-13; M2-B: PMA + M-CSF; and M2-C: IL-4 + IL-13. For primary monocytes, mock: no stimulated cells; M1: GM-CSF + LPS + INF-γ; and M2: M-CSF + IL-4 + IL-13. U937 cells did not produce IL-12p70 under any condition. Asterisks and bars denote statistical significance between conditions. Significance ≤0.05 was indicated with ∗, ≤0.01 was indicated with ∗∗, and ≤0.0005 was indicated with ∗∗∗. In THP-1 cells IL-1β, IL-8, G-CSF, and GM-CSF were significantly different between M1 versus M2 and M2 without PMA; EGF, (mock, PMA, and M1) versus M2 and M2 without PMA. In U937 cells IL-1β, G-CSF, INF-α2, and GM-CSF, M1 versus (M2-A, M2-B, and M2-C); EGF, PMA and M1 versus M2-A and M2-C. In primary monocytes IL-1β, IL-8, RANTES, G-CSF, INF-α2, IL-12p70, and GM-CSF, M1 versus M2; EGF, mock and M1 versus M2.

