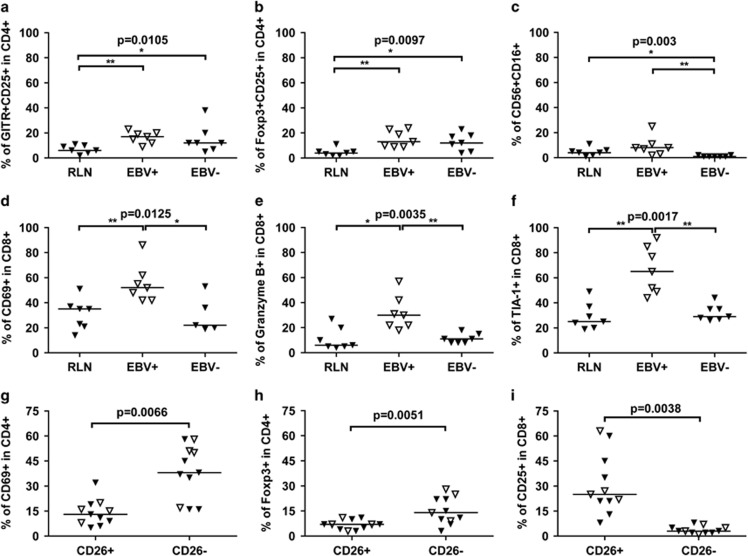
Figure 1.
Significantly different immune cell populations in cHL. Optimized concentrations of fluorochrome-antibody conjugates were applied on cell suspensions of cHL tissue and analyzed by flow cytometry. (a–f) Significant differences in immune cell populations between RLN and EBV+ and EBV− cHL. Percentages of (a) GITR+CD25+ in CD4+ cells; (b) FoxP3+CD25+ in CD4+ cells; (c) CD16+ in CD56+ cells; (d) CD69+ in CD8+ cells; (e) Granzyme B+ in CD8+ cells; (f) TIA-1+ in CD8+ cells. An overview of all subsets tested and of all results has been given in Supplementary Tables S1–3. Lines indicate the median percentage of each group. Kruskal–Wallis test was used to test for differences in all three groups and a P-value of 0.0125 (to correct for multiple testing) was considered to be significant. Mann–Whitney U test was used as a post hoc test to identify significant differences in groups. (*P<0.05; **P<0.01). (g–i) Cell populations with significant differences between CD26− and CD26+ T cells in cHL overall and EBV-stratified subgroups. (g) Percentages of CD69+ in CD4+ cells in cHL; (h) FoxP3+ in CD4+ cells in cHL; (i) CD25+ in CD8+ cells in cHL. Lines indicate the median percentage of each group. Wilcoxon-matched-pairs signed-rank test was used to compare the two groups.

