Figure 2.

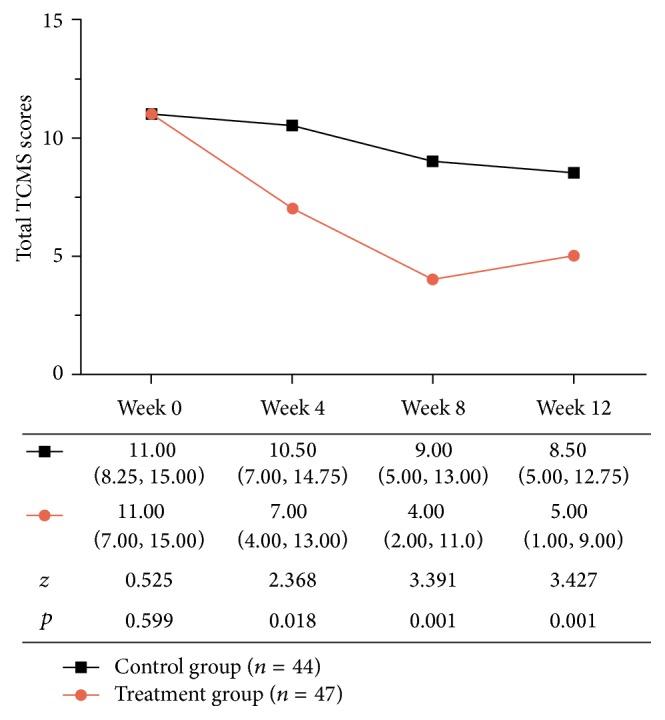
Total Traditional Chinese Medicine Symptom (TCMS) scores during treatment; values are presented as median (interquartile range). p values represent the treatment group versus the control group.

Total Traditional Chinese Medicine Symptom (TCMS) scores during treatment; values are presented as median (interquartile range). p values represent the treatment group versus the control group.