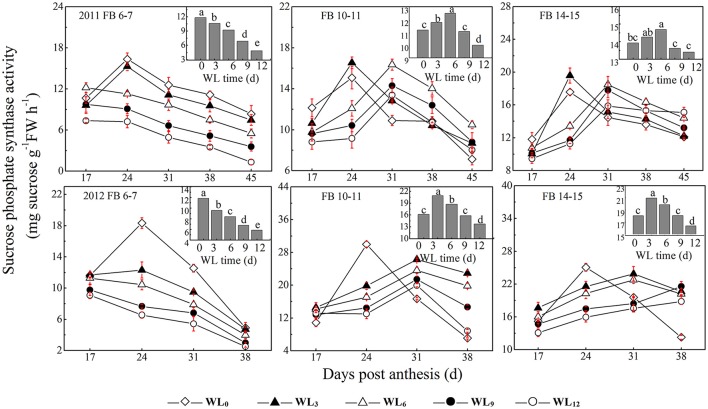
Figure 3.
Effects of the waterlogging time on dynamic changes in fiber sucrose-synthesis enzyme activity at different main-stem fruiting branches (sucrose phosphate synthase). Columns represent the average activities per day post-anthesis. Data (n = 3) are represented as the mean values ± SD calculated from three replicates. Open diamond, closed triangle, open triangle, closed circle and open circle represent WL0, WL3, WL6, WL9, and WL12 (waterlogging for 0, 3, 6, 9, and 12 days), respectively. WL indicates waterlogging.

