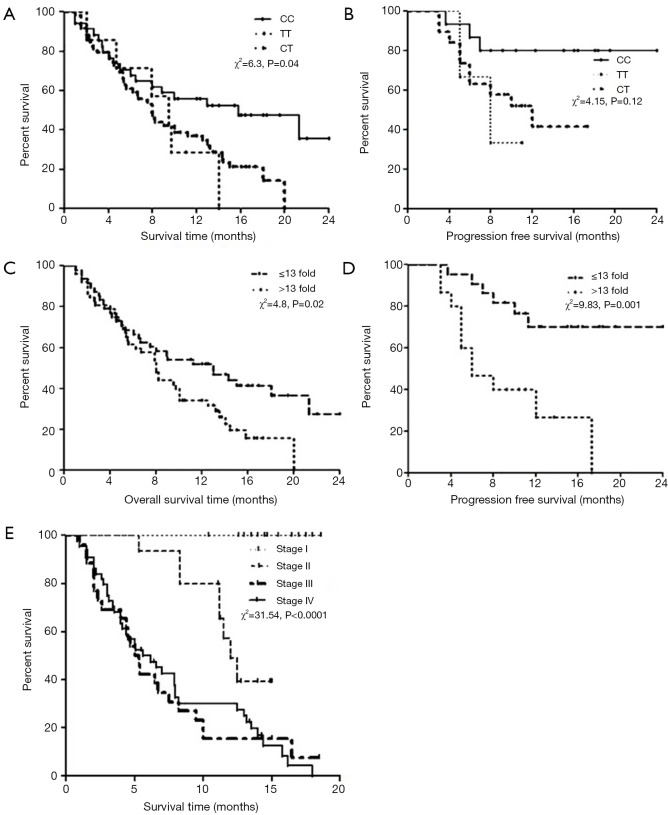
Figure 2.
Kaplan-Meier survival curves with respect to HER2 (-3444C/T) genotype. (A) Overall survival with respect to CC, CT and TT genotype; (B) progression free survival with respect to CC, CT and TT genotype; (C) overall survival with respect serum HER2 mRNA expression; (D) progression free survival with respect serum HER2 mRNA expression; (E) overall survival with respect to TNM stage of NSCLC patients.

