FIG 2 .
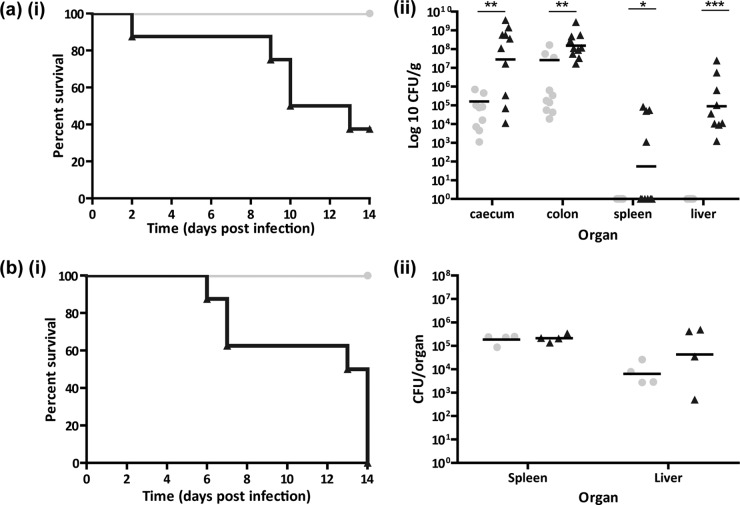
F2 Giftm1a/tm1a mice are susceptible to C. rodentium and S. Typhimurium pathogen challenges. (a, part i) Kaplan-Meier curve showing percent survival following infection of F2 Giftm1a/tm1a and wild-type mice with C. rodentium (n = 8). (a, part ii) Enumeration of C. rodentium bacteria in cecal, colon, spleen, and liver tissues of surviving F2 Giftm1a/tm1a and wild-type mice at day 14 p.i. (b, part i) Kaplan-Meier curve showing percent survival following infection of F2 Giftm1a/tm1a and wild-type mice with S. Typhimurium (n = 8). (b, part ii) Enumeration of S. Typhimurium bacteria in the spleens and livers of F2 Giftm1a/tm1a and wild-type mice at day 14 p.i. Gray circles represent wild-type mice. Black triangles represent F2 Giftm1a/tm1a mice. Black bars represent geometric mean values. ***, P < 0.001; **, P < 0.01; *, P < 0.05 (ANOVA with Dunn’s multiple-comparison post hoc test).

