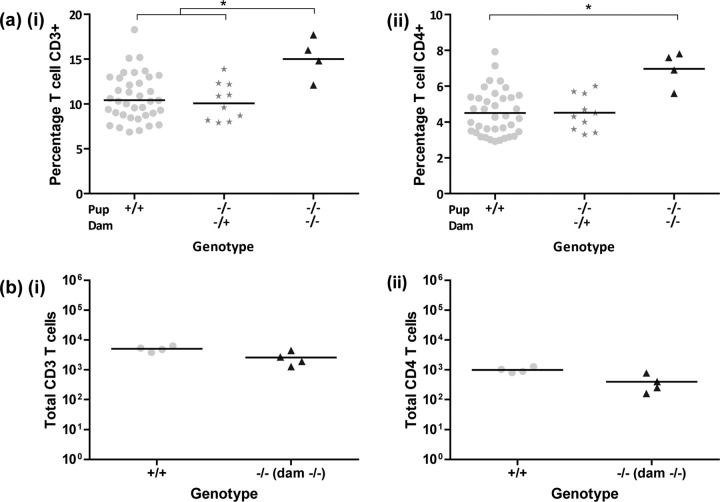
FIG 4 .
Immune cell profiling of naive and S. Typhimurium-challenged F2 Giftm1a/tm1a and wild-type mice. (a) Analysis of peripheral blood leukocytes from 16-week-old naive mice showing percentages of CD3+ (i) and CD4+ (ii) T cells. (b) Analysis of spleen cells from S. Typhimurium-infected mice on day 14 p.i. for total CD3+ (i) and total CD4+ (ii) T cells. Samples were analyzed on a BD LSR Fortessa or BD LSR II apparatus. Interpretation of the results was performed with FlowJo v9. Black bars represent geometric mean values. *, P < 0.05 (one-way ANOVA followed by Dunn’s multiple-comparison post hoc test).

