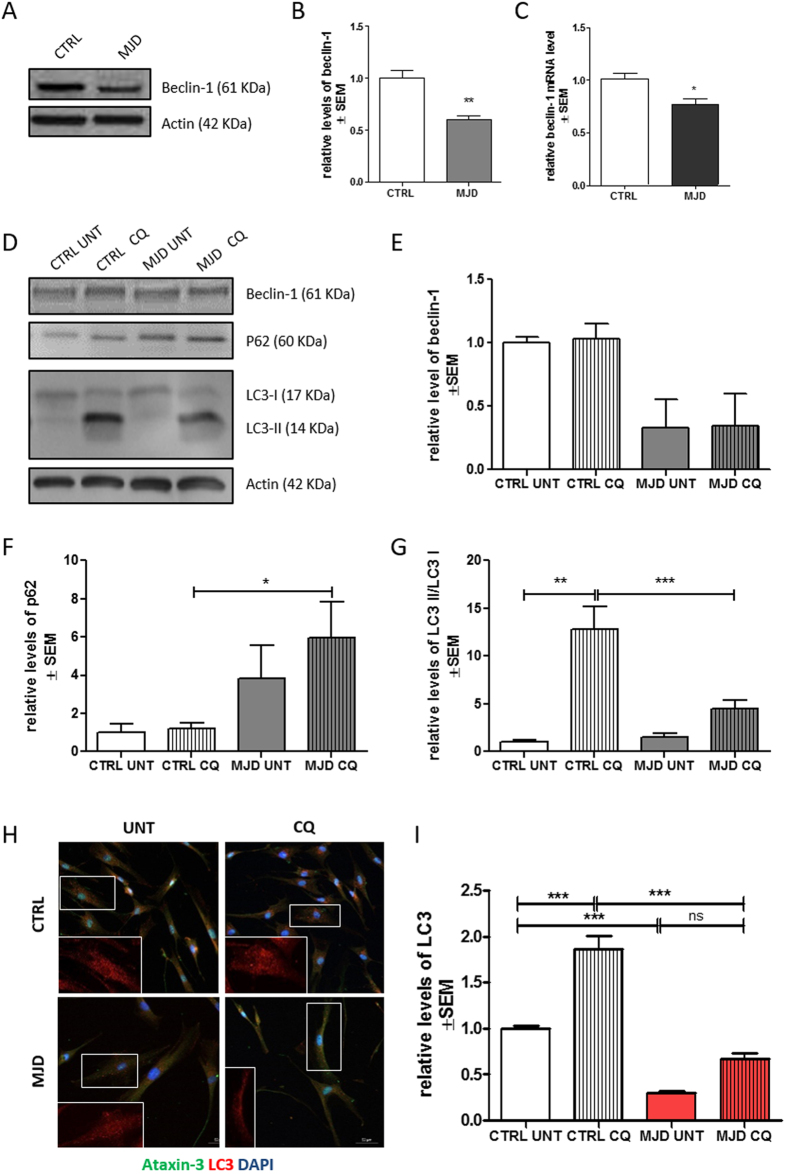
Figure 4. Defining MJD autophagic dysfunction phenotype.
Representative western blot of Beclin-1 (61 kDa) (t student n = 3/n = 4 **p = 0.01) in human fibroblasts (A,B) and qRT-PCR analysis of beclin-1 (t student n = 3/n = 4 *p = 0.05 (C). Representative western blots (D) of beclin-1 (61 kDa) (E), p62 (60 kDa) (F), LC3-II and LC3-I (14 and 16 kDa) and LC3-II/LC3-I (G) levels in human fibroblasts after treatment with chloroquine (CQ). (H). 1way ANOVA with Bonferroni post test (*p < 0.05; **p < 0.01) n = 3/n = 3. Immunostaining of cultured fibroblasts obtained from skin biopsies with ataxin-3 (green), LC3 (red), and DAPI (blue) (H). Quantification of LC3, based on LC3 immunoreactivity, normalized for CTRL UNT condition (I). Levels of LC3 were significantly higher after chloroquine treatment in CTRL (One way ANOVA n = 3/n = 3***p = 0.001). Scale bar: 50 μm. Full length western blot membranes are provided in supplementary information, S2.

