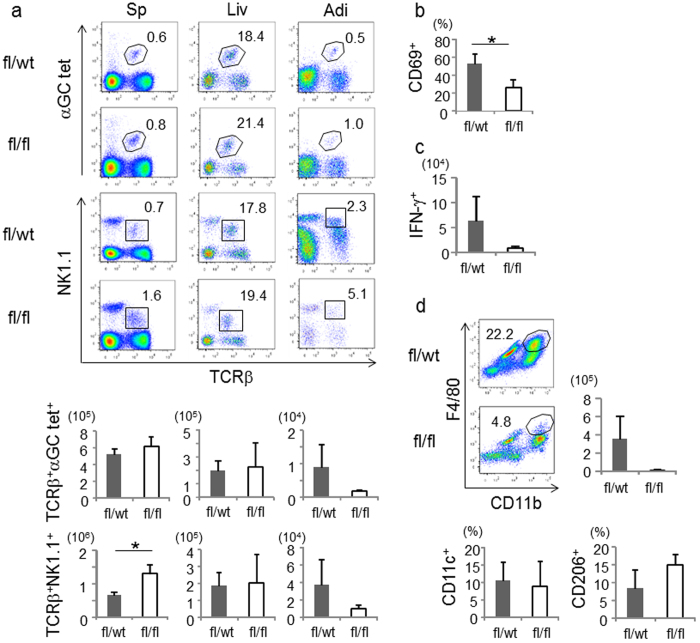
Figure 8. The activation of NKT cells and accumulation of macrophages in CD1df/f-adipoq-cre mice is suppressed.
(a) Representative flow cytometric data of iNKT cells (TCRβ+αGC tet+) and NKT cells (TCRβ+NK1.1+) in spleen, liver and adipose tissue after feeding of HFD for 8 wk. The graph shows the cell number (n = 4 in each group). (b) The frequency of CD69+ NKT cells in adipose tissue (n = 4 in each group). (c) The cell number of IFN-γ+ NKT cells in adipose tissue (n = 4 in each group). (d) Representative flow cytometric data of macrophages (CD11b+F4/80+) and cell number. The graph shows the frequency of CD11c+ macrophages (M1) and CD206+ macrophages (M2) (n = 4 in each group). Representative data from at least 2 independent experiments are shown. Data are shown as mean ± s.d. Statistical analysis was performed according to the Student’s t-test. *P < 0.05, **P < 0.01.

