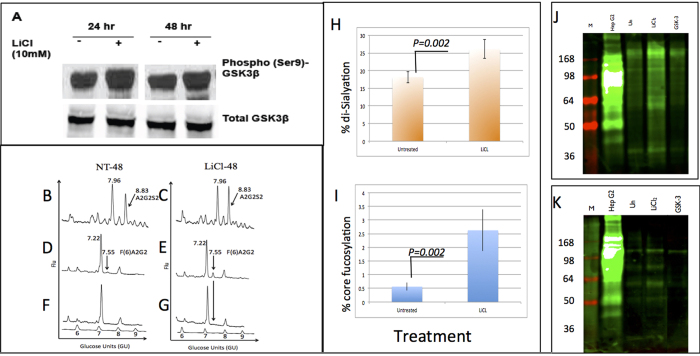
Figure 6. Changes in glycosylation with LiCl-induced activation of β- catenin detected by normal phase HPLC and lectin blotting.
(A) Confirmation of LiCl effects in primary rat hepatocytes. Cells treated with LiCl for 24 or 48 hours. Phospho-GSK3β levels were analyzed by immunoblot. (B–G) Glycans were released from proteins from PRH left untreated (NT-48) or treated with LiCl for 48 hours (LiCl-48) and analyzed by normal phase HPLC as described in the text. (B,C) N-linked glycan profiles from untreated and LiCl treated cells. An altered glycan peak in LiCl-treated cells is indicated (arrow). (D,E) Samples further digested with Arthrobacter ureafaciens sialidase. An increased level of core fucosylation at GU7.55 in LiCl-treated cells is indicated (arrow). (F,G) Bovine kidney fucosidase treatment shifts this peak, indicating that it represents core fucosylation. For panels B–G, glucose values are provided for the major peaks and the GU ladder is provided along the X-axis. Y-axis for these panels represents the fluorescent intensity of glycan. (H,I) Quantification of the alteration in sialylation (H) and fucosylation (I) following LiCl treatment. (J,K) Lectin blot analysis of independently isolated PRH, left untreated or LiCl-treated for 48 hours. 10 μg of total cellular protein was resolved by SDS-PAGE and sialylated protein (J) or fucosylated protein (K) was detected by lectin blotting. Sialylated proteins were detected using the Sambucus nigra lectin (SNA), which binds to α-2,6 and to a lesser degree to α-2,3 linked sialic acid. (K) Increases in fucosylation were detected using the core fucose binding lectin N224Q rAAL (see Methods). HepG2 hepatoblastoma cells serve as a positive control (+). For J and K: M is marker lane, + is HepG2 control, U is untreated, and LiCl is treated. Molecular weight markers sizes are shown to the left of the gel. For space concerns, Fig. 6A contains cropped images showing the change in Phospho-GSK3β levels.

