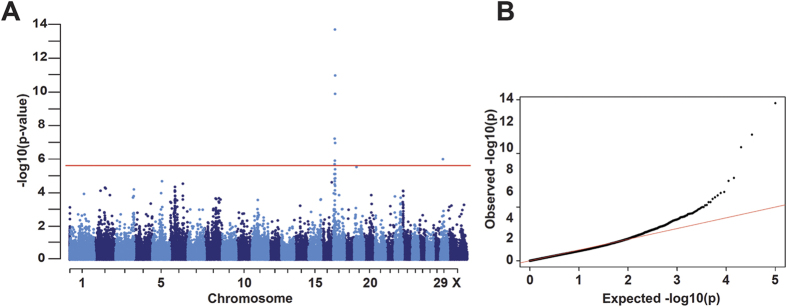
Figure 1. Genome-wide association study for coat color in Boer goats.
Comparison of 15 solid-colored versus 172 Boer goats (traditional and spotted). The red line in the Manhattan plot indicates the Bonferroni significance threshold for association (−log10 p = 6.00) showing seven genome-wide significantly associated SNPs on chromosome 17 and one on chromosome 29. (B) The quantile-quantile (QQ) plot shows the observed versus the expected log p-values. The straight red line in the QQ plot indicates the distribution of SNP markers under the null hypothesis, and the skew at the right edge indicates that these markers are stronger associated with the trait than it would be expected by chance.

