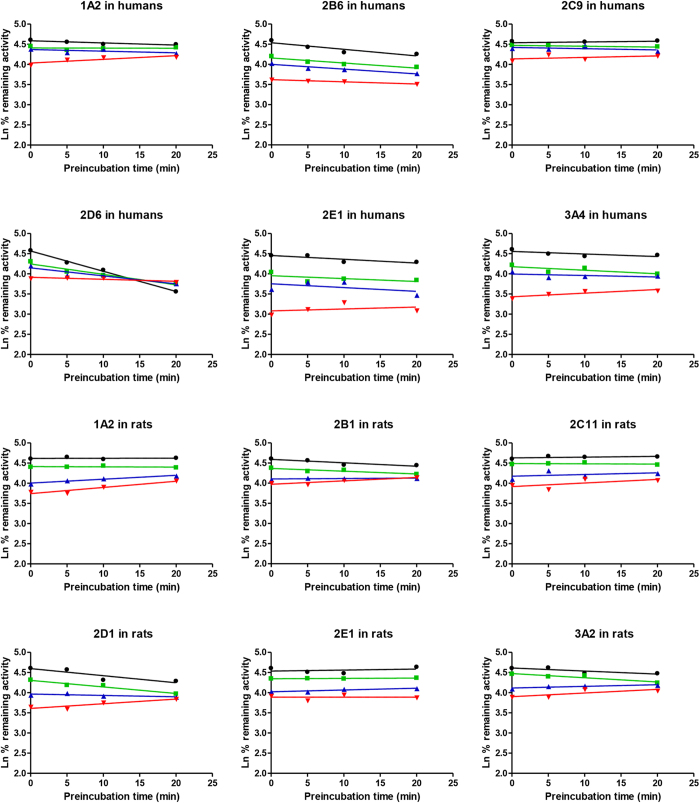
Figure 2. Time- and concentration-dependent inhibition of human and rat liver microsomal CYPs.
The figures were prepared by a semilogarithmic plot of percent remaining activity vs incubation time. Microsomal reaction mixtures were pre-incubated for 20 min without (⚫) or with plumbagin at 0.5 μM ( ), 1 μM (
 ), 2 μM (
 ) in humans or plumbagin at 0.2 μM (
 ), 0.5 μM (
 ), 1 μM (
 ) in rats. Each data point represents the mean of quadruplicate determinations.

