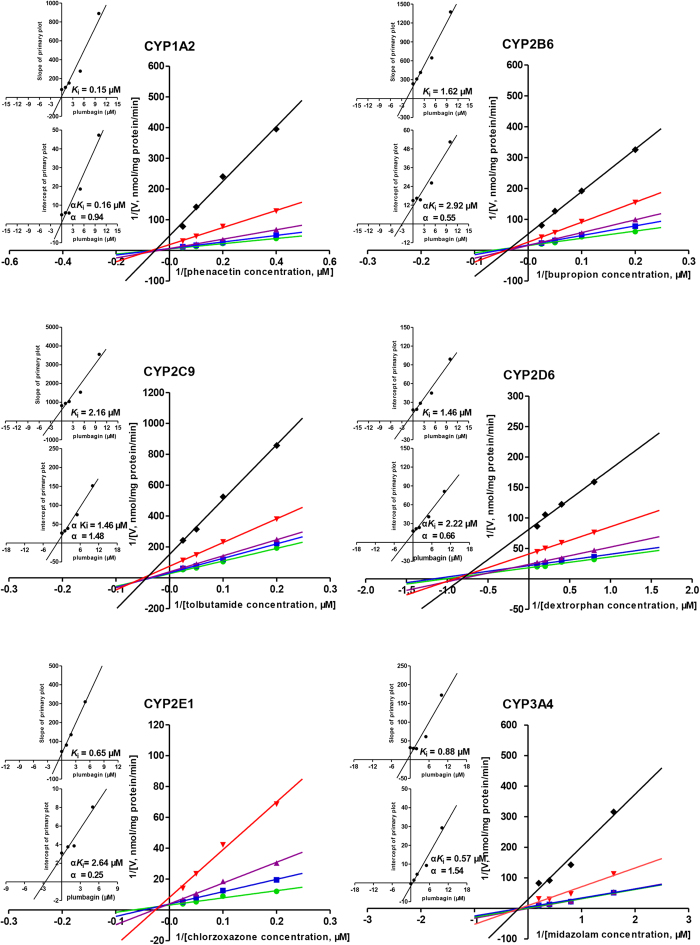
Figure 3. Primary Lineweaver–Burk plot, the secondary plot for Ki and the secondary plot for αKi in the inhibition of CYP-mediated probe substrate metabolism by various concentrations of plumbagin (0 , 1
, 1 , 2
, 2 , 5
, 5  , 10♦ μM) in pooled human liver microsomes.
Phenacetin was used at concentrations of 2.5, 5, 10 and 20 μM; Bupropion was used at 5, 10, 20 and 40 μM; Tolbutamide was used at 5, 10, 20 and 40 μM; Dextromethorphan was used at 1.25, 2.5, 5 and 10 μM; Chlorzoxazone was used at 5, 10, 20 and 40 μM; Midazolam was used at 0.625, 1.25, 2.5 and 5 μM. Each data point represents the mean of quadruplicate determinations.

