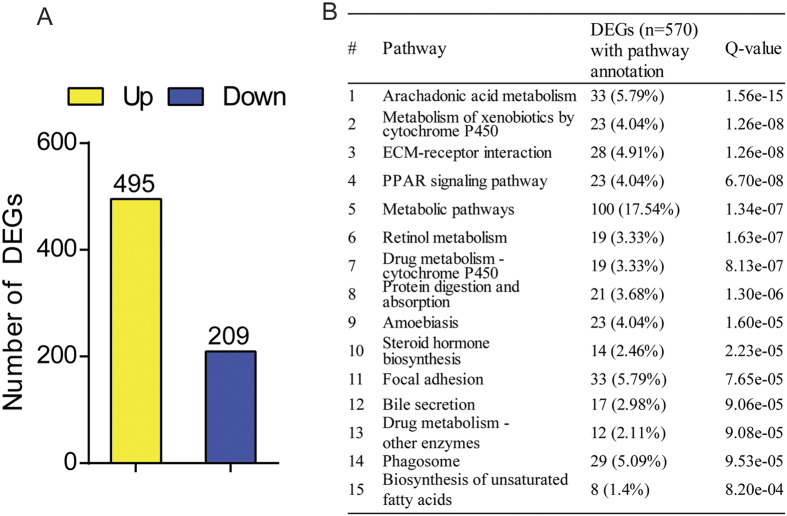
Figure 4. Neil3 deficiency modulates expression of hepatic genes.
(A) The numbers of genes that were significantly up- and downregulated in Apoe−/−Neil3−/− as compared to Apoe−/− mice by RNA sequencing analysis. (B) KEGG pathway enrichment analyses showing the top 15 pathways significantly enriched in differentially expressed genes (DEGs). Percentages were calculated based on the total number of genes (n = 570) with pathway annotations. Q values are FDR-adjusted p-values and a Q value <0.05 was considered as significant. RNA sequencing was performed on pooled RNA from the liver of 7 Apoe−/− and 9 Apoe−/−Neil3−/− mice.

