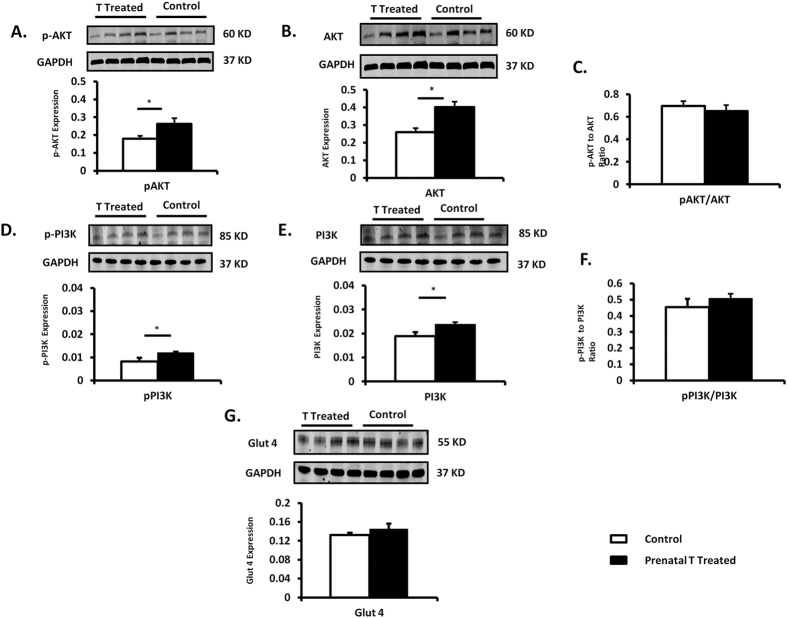
Figure 2. Protein expression (Mean ± SEM) of total and phosphorylated proteins involved in insulin signaling pathway (n = 7–8 per group).
Two tail student t-test was used to test difference between T-treated and control and * assigned to p < 0.05. The Cohen’s effect size analysis revealed large differences between T-treated and control group for PI3K, AKT total and phosphorylated proteins involved in insulin signaling pathways (cohen’s d: PI3K = 1.68, pPI3K 2.53; AKT = 1.83, pAKT = 1.14) and small differences in GLUT 4 (cohen’s d: 0.57).

