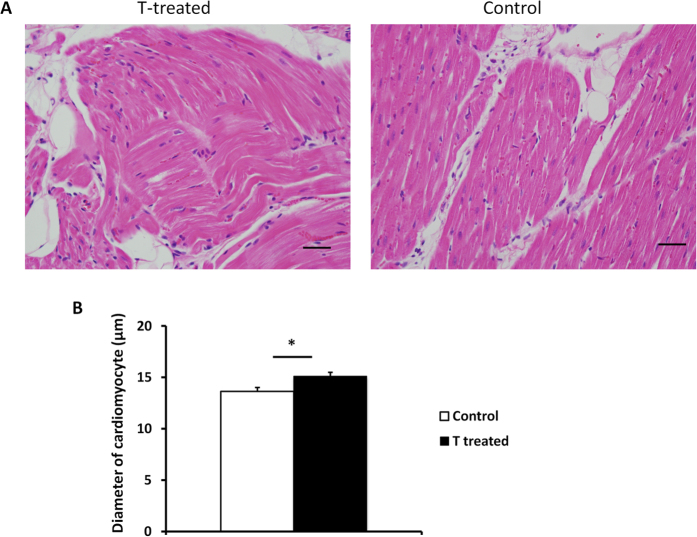
Figure 6.
(A) Representative histological sections of H&E stained sections from left ventricle tissue from two-year-old prenatal T-treated sheep (A) and control (B). (B) Effect of prenatal T treatment on the mean diameter of cardiomyocytes. * Denotes p- value < 0.05. The Cohen’s effect size found large differences between T-treated and control groups with respect to cardiomyocyte width (Cohen’s d = 1.473).

