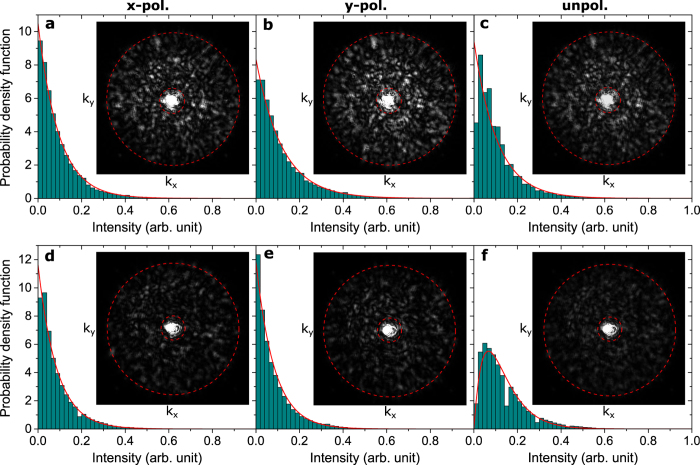
Figure 6. Statistics of scattered light.
Measured (histogram plot) and theoretical (red line) PDF of the reflected far-field intensity (when neglecting specular reflection) from GSP-based metasurfaces with (a–c) fully correlated and (d–f) statistical independent reflection phases for orthogonal polarisations. The wavelength of the incident light is 800 nm and it is either (a,d) x-, (b,e) y- or (c,f) un-polarised. The insets show the associated Fourier images of the far-field intensity within the NA = 0.55, with the area bounded by the dashed circles indicating the scattered light used for the statistics. It should be noted that the Fourier images in (c,f) are the average of (a,b,d,e), respectively, weighted so that the average intensity in the x- and y-polarised images is the same.

