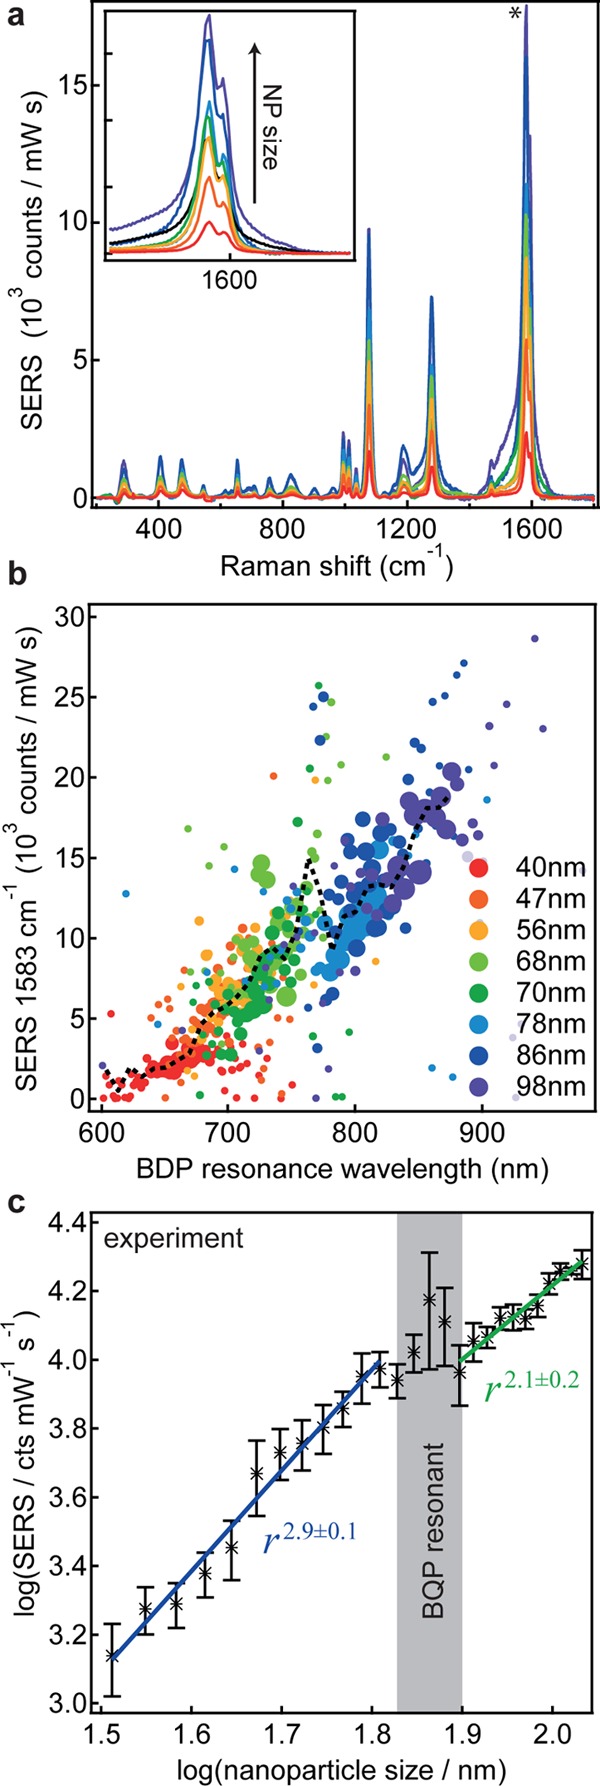
Figure 4.

Correlation of SERS intensity and scattering resonance. (a) SERS spectra of a biphenyl-4-thiol self-assembled monolayer in the NPoM geometry with different nanoparticle sizes. the inset shows an enlarged view of the phenyl mode at 1583 cm–1. (b) SERS intensity as a function of the BDP resonance wavelength for over 10 000 single nanoparticles. For clarity, the single points are binned, and marker size gives the number of single spectra per bin. (c) Log–log plot of the average SERS intensity versus nanoparticle size.
